

Chart Pattern Series (1/12): Symmetrical Triangle Pattern6 min read
Chart patterns can provide valuable insights into the behavior of buyers and sellers in the market. By identifying chart patterns, you can gain a better understanding of potential price movements and make more informed trading decisions. These patterns can be used to identify areas of support and resistance, which can be important indicators of future price movements. In this first article of the new Chart Pattern series, we will delve into the Symmetrical Triangle pattern.
If you haven’t already be sure to check out the other series!
- Descending Triangle Pattern
- Ascending Triangle Pattern
- Pennant Chart Pattern
- Rising Wedge Chart Pattern
- Falling Wedge Pattern
- Bull Flag Pattern
- Bear Flag Pattern
Table of Contents
What is the Symmetrical Triangle Pattern?
The symmetrical triangle chart pattern forms when the price is creating lower highs and higher lows as it consolidates – it is therefore a volatility contraction pattern. If you drew trendlines connecting the lower highs and higher lows, the upper bound is downward-sloping and the lower bound is upward-sloping.
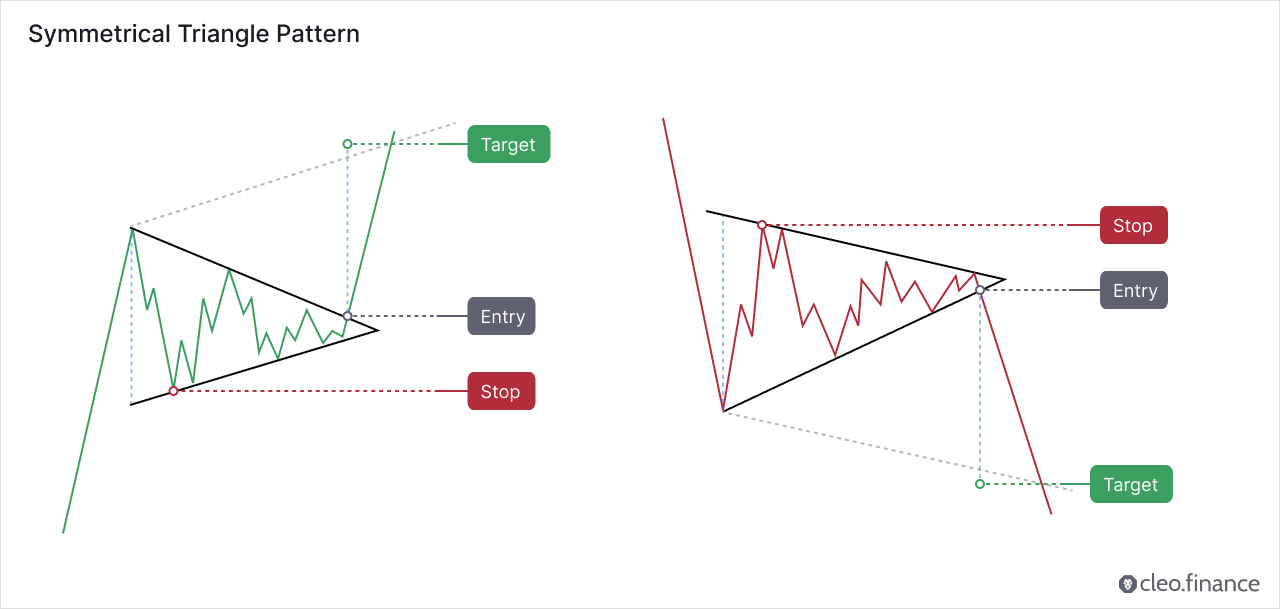
To confirm the validity of the symmetrical triangle pattern, the price should touch both the upper and lower trend lines at least twice while staying within the triangle area. Neither the bulls nor the bears have control over the current movement during the pattern.
Is a Symmetrical Triangle a Continuation or Reversal Pattern?
The triangle chart patterns can be both continuation and reversal patterns. Although there is a slightly higher likelihood of a price breakout in the direction of the overall trend, it is best to approach any symmetrical triangle pattern as neutral.
The most in-depth publicly available research into chart patterns as a whole was performed by Thomas Bulkowski. He analyzed daily data on US equities and found over 3,000 trades based on the breakout of the Symmetrical Triangles pattern. Performance, however, left a lot to be desired. Out of all the chart patterns Bulkowski tested, Symmetrical Triangles performed as bad as a pattern could. They ranked 36th of the total 39 chart patterns for upward breakouts and 34th out of 36 tested chart patterns for downward breakouts.
How to identify a good Symmetrical Triangle Pattern?
A good Symmetrical Triangle Pattern should have declining volume associated with the volatility crunch. Significant volume on the breakout means an increased chance of a valid breakout, especially if it is a breakout to the upside.
Where to place Target and Stop Loss?
Target can be set in two ways:
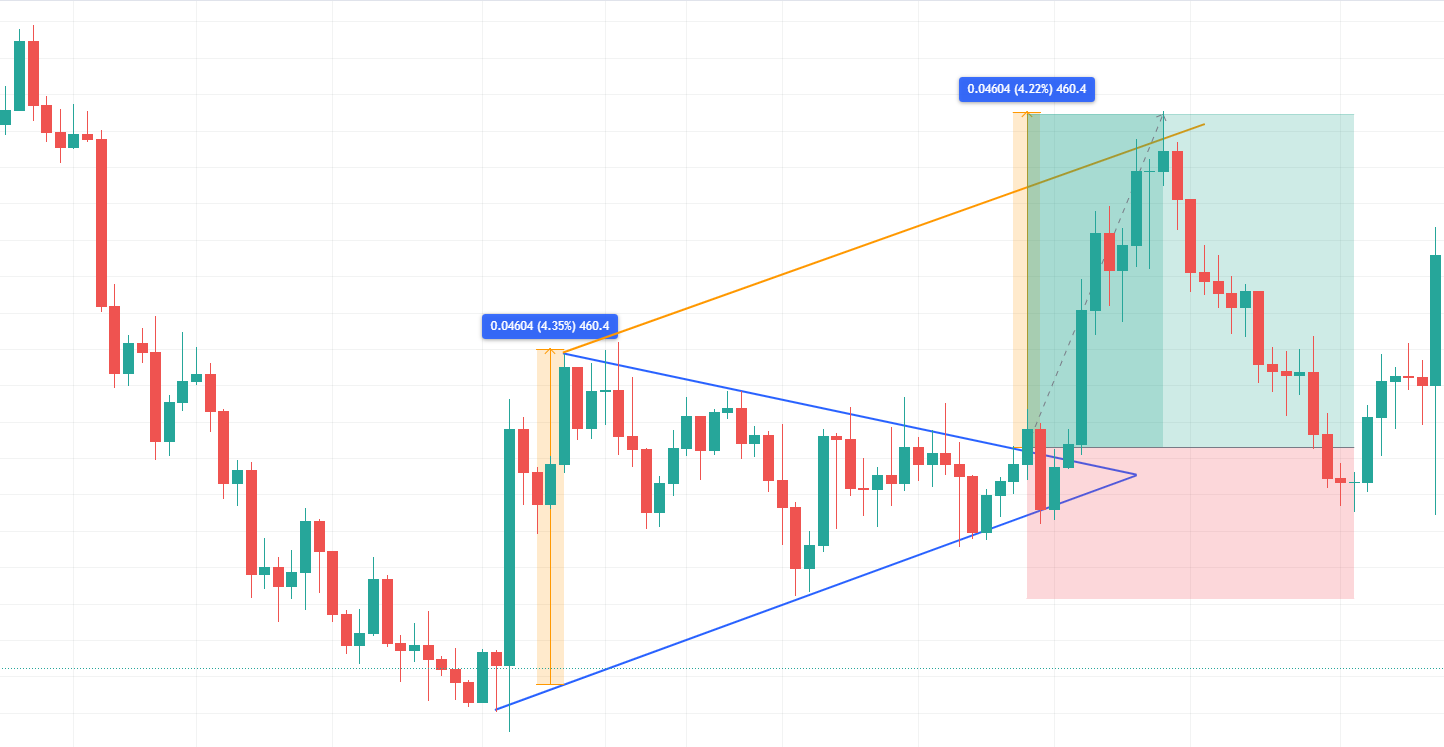
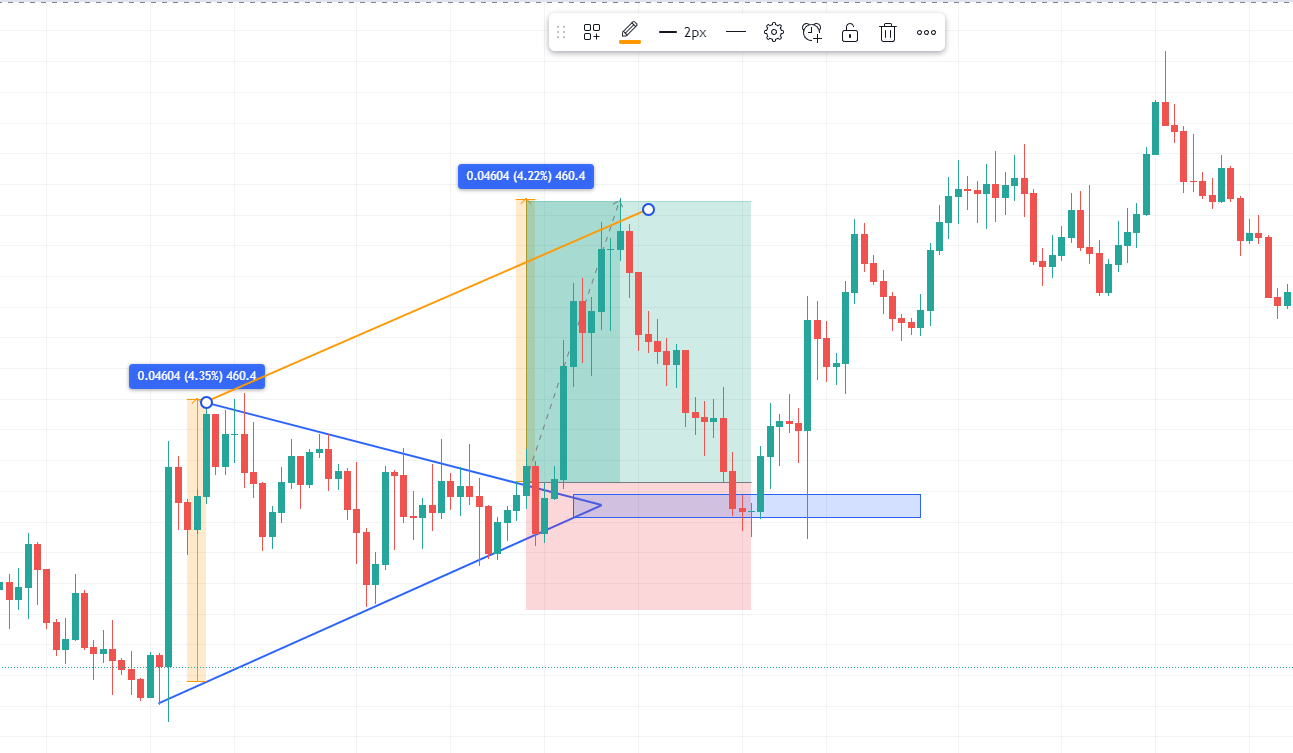
- Measure the widest point of the triangle: Apply the widest distance of the triangle to the pattern’s breakout point in the direction of the breakout.
- Draw a parallel trendline: Draw a trendline parallel to the trendline that slopes in the direction of the breakout.
Stops are usually placed above/below the second touch in the opposite direction of the breakout. This should yield around 2R trade (for every 1 unit of risk we expect 2 units of reward).
As Bulkowski points out, the pullback/throwback rate back to either the point of breakout or the apex point is more often than not. In about 6/10 times the price does retraces back to the origin, which affects the pattern’s performance. So, take this into account if you’re considering using Trailing Stop loss while trading this chart pattern.
How to trade a Symmetrical Triangle Pattern automatically?
With the trendline trading tool on cleo.finance, you can now easily automate chart pattern trading as entry and exit rules in your trading strategy without constantly monitoring the markets.
Step-by-step guide
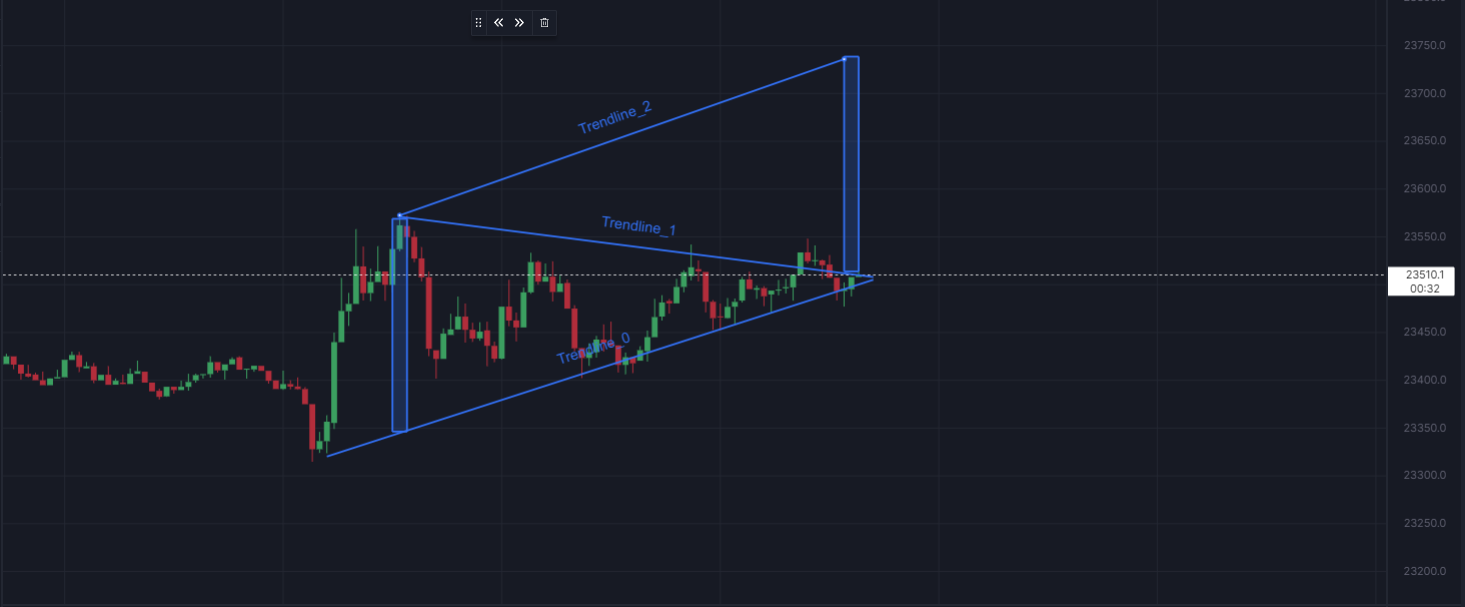
1. Locate the trendlines on the Cleo.Finance chart: Look for the trendlines that connect the lower highs and higher lows. The upper bound should be downward-sloping, and the lower bound should be upward-sloping.
2. Draw the trendlines on the Cleo.Finance chart: Once you’ve located the trendlines, draw them on the chart. The trendline will have an auto-generated name that you’ll need to use in the entry or exit conditions.
3. Set your target and stop loss: You have two options for setting your target and stop loss. The first option is to draw a rectangular along the widest point of the triangle and draw another rectangular at the same height, placing it over the cradle of the triangle. Set your target as the same as the height of the rectangular. Place your stop loss below the second touch of the candle.
4. Find your entry and exit trendline: Once you’ve set your stop loss and take profit, you can find your entry and exit trendline on the conditions writing in drawing> Trendline.
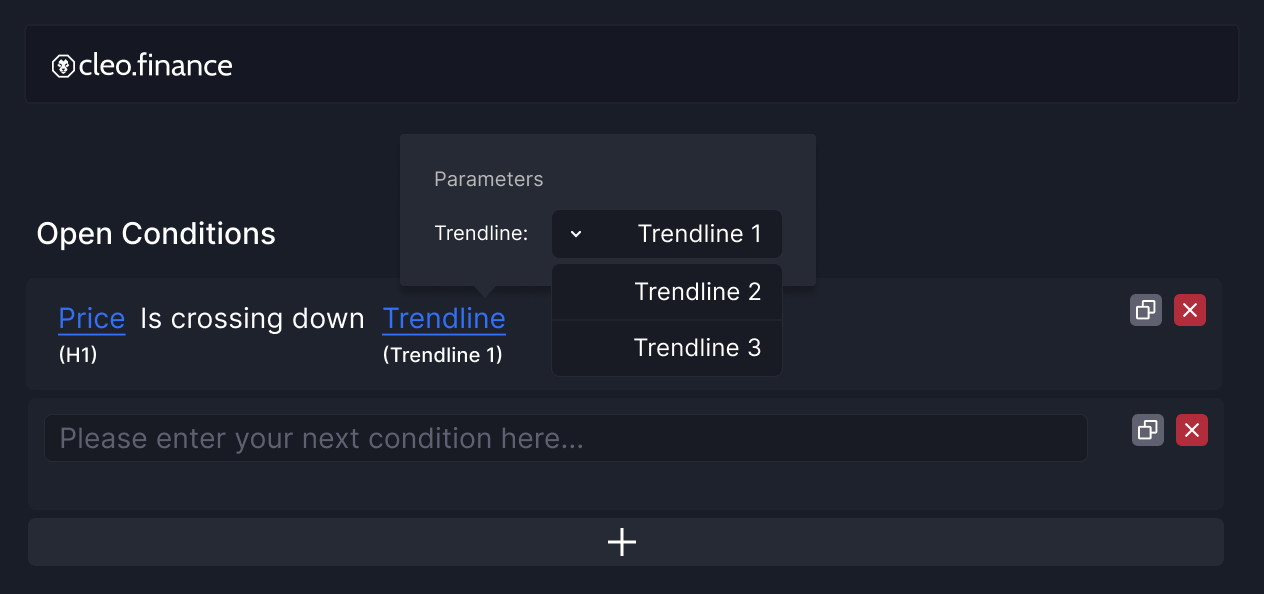
5. Write your conditions: Start writing your conditions “Price” and then pick the comparison you want. Your drawn trendlines will be available in the drawing> Trendline section.
6. Set your volume, take profit, and stop loss. All set and now you can hit the deploy live button.
Conclusion
Symmetrical triangle pattern has a bad reputation but can be quite powerful if used right. The best results can be achieved if using the symmetrical triangle in conjunction with other indicators – primarily volume, potentially key levels, and momentum indicators.
Cleo.finance’s trendline trading tool gives you the space to optimize your trading approach, you can easily identify the chart patterns and draw your trendlines right on the chart. Incorporate them into your automated trading system and combine them with over 55 technical indicators, candlestick patterns, and more!