Chart Pattern Series (3/12): Ascending Triangle Pattern7 min read
Chart patterns are important tools and they can provide a better understanding of potential price movements and make more informed trading decisions. Using chart patterns will help you increase your competitive edge in the trading world. In this 3rd article of the chart pattern series, we will be discovering the Ascending Triangle Pattern.
If you haven’t already be sure to check out the previous series!
- Symmetrical Triangle Pattern
- Descending Triangle Pattern
- Pennant Chart Pattern
- Rising Wedge Chart Pattern
- Falling Wedge Pattern
- Bull Flag Pattern
- Bear Flag Pattern
Table of Contents
What is the Ascending Triangle Pattern?
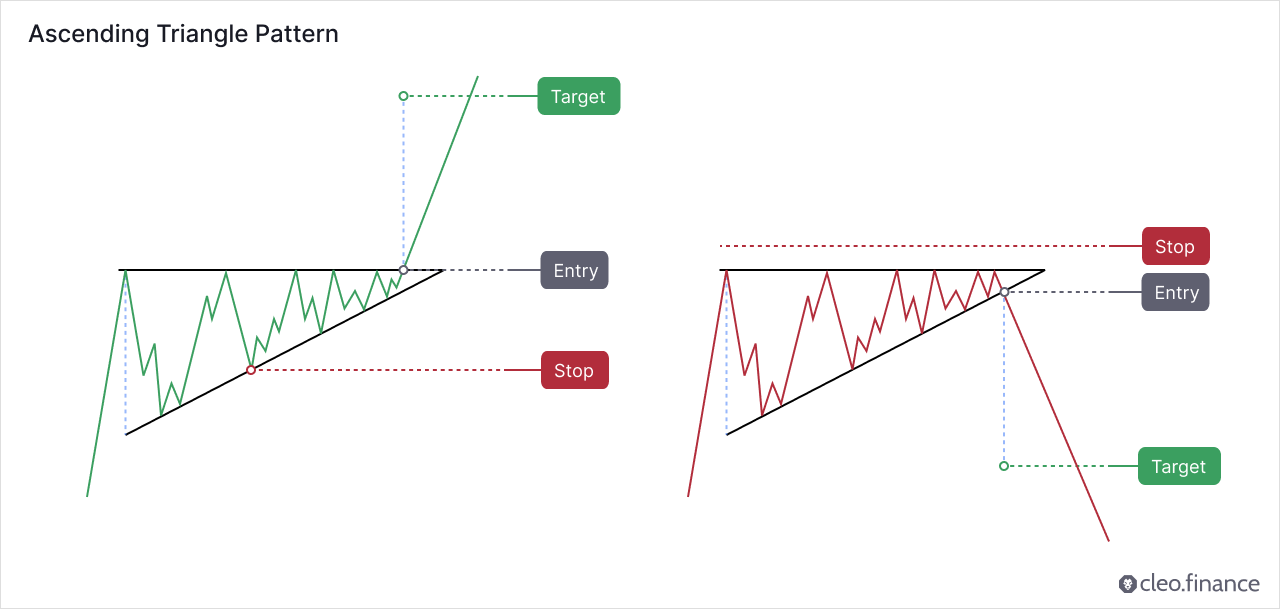
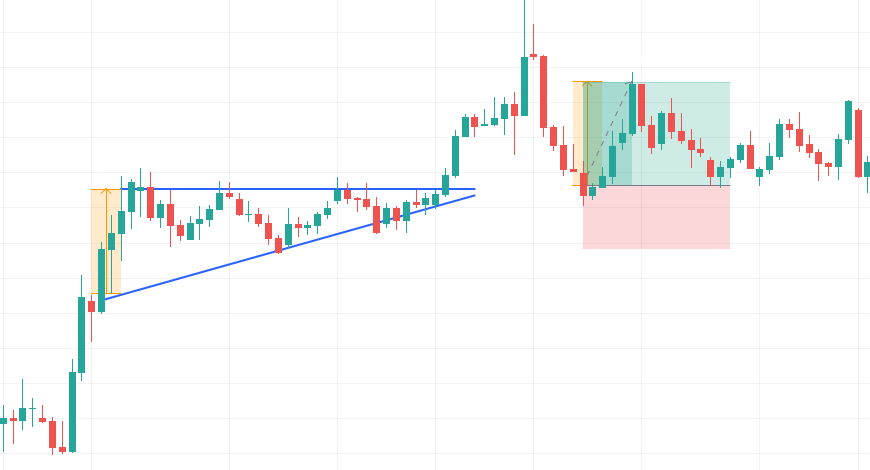
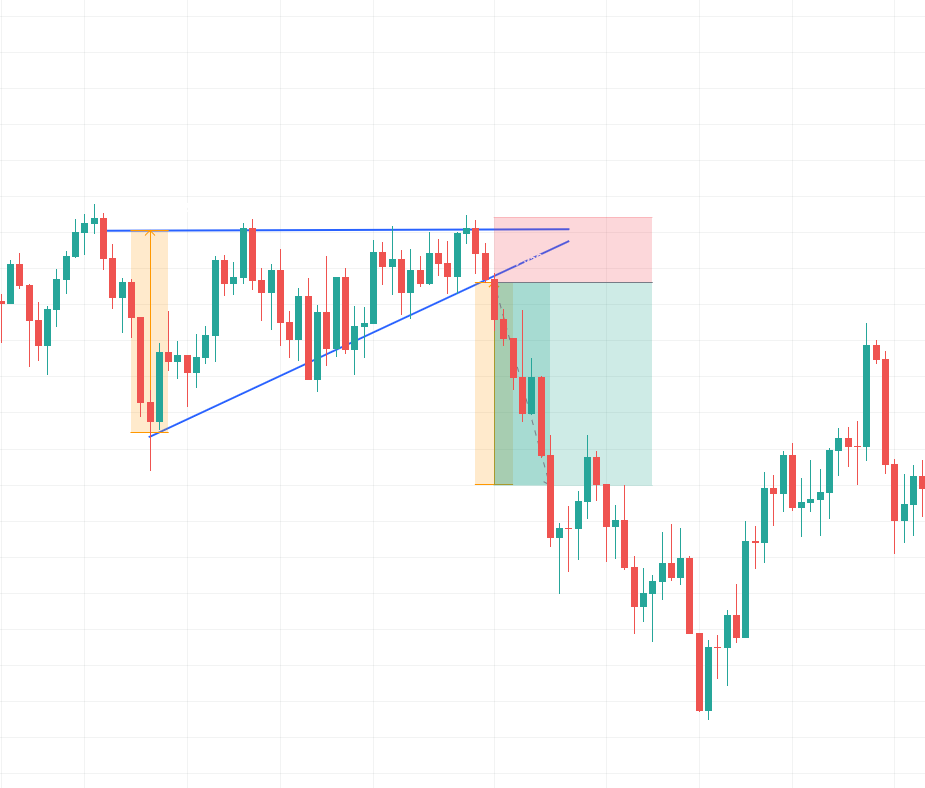
An ascending triangle is formed by a horizontal upper limit of resistance with minor highs and an upward-sloping lower limit of support with minor lows. The two lines join at the triangle
apex. The breakout points have to be chosen carefully since this pattern is prone to have many small false breakouts. As the price oscillates between the upper resistance level and lower support level, volume usually diminishes.
Upward breakouts are commonly more successful than downward ones. On the other hand, downward breakouts tend to have lower break-even failure rates than upward breakouts. The differences in failure rates are generally small, where downward breakouts have a failure rate of only 3%, a quarter of the 12% rate for upward breakouts.
Traders should be cautious of patterns with empty spaces with not enough crossings between two lines. To confirm the validity of an ascending triangle chart pattern, traders should instead look for multiple touches of the top trendline by minor highs, and the bottom trendline by minor lows. The more touches there are on both of the trendlines, the more valid and significant the pattern becomes. Volume tends to decline as the pattern forms.
Is Ascending Triangle a Continuation or Reversal Pattern?
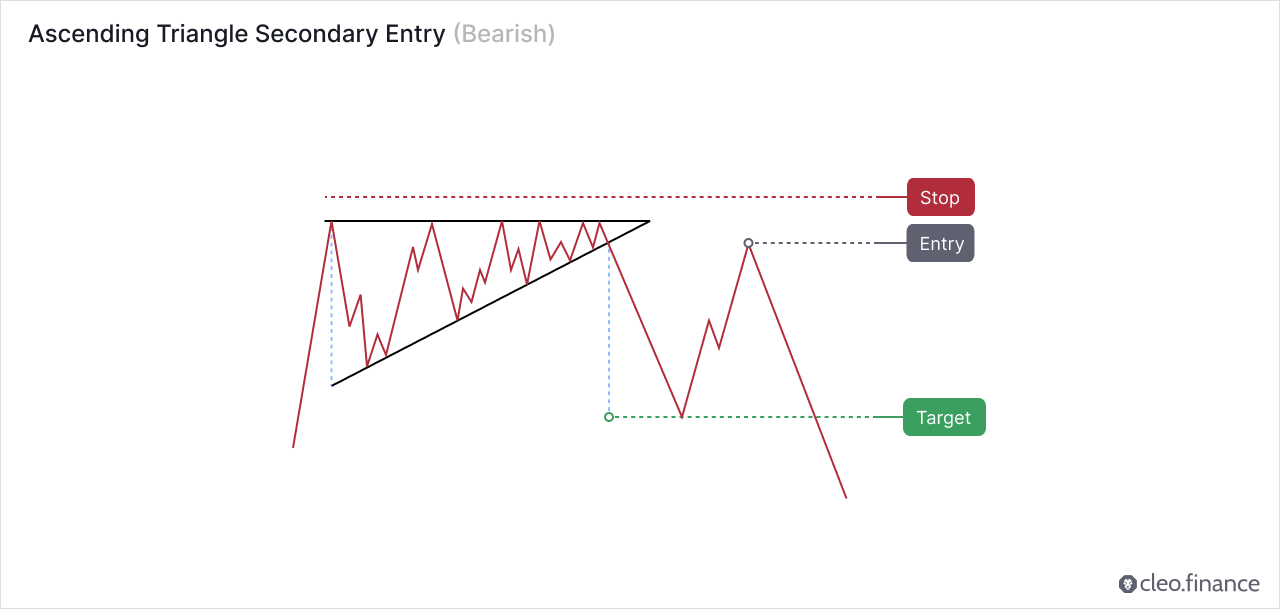
When an ascending triangle experiences an upward breakout, it signals a reversal of a previous downward price trend and a downward breakout indicates a continuation of the downward trend. It is important to approach the pattern with neutrality until a clear breakout is confirmed. The breakout point must be chosen carefully because the pattern has a tendency to have many small false breakouts.
Thomas Bulkowski is credited with carrying out the most extensive publicly available research on chart patterns. He analyzed daily data on US equities and identified more than 1,400 trades based on the breakout of the Ascending Triangle chart pattern. His results indicate that the Ascending Triangle tends to perform well in upward breakouts, compared to downward breakouts. The pattern ranked 16th out of 39 chart patterns for upward breakouts and 30th out of 36 chart patterns for downward breakouts.
How to identify a good Ascending Triangle Pattern?
The Ascending Triangle example can be relatively easy to identify compared to other chart patterns after learning the identification factors. However, it is important to keep in mind that while the ascending triangle might be easy to identify, it still requires a careful approach and analysis with confirmatory indicators. This is because the characteristics of this pattern can be erratic, as mentioned above.
To spot a good Ascending Triangle pattern, look for an established uptrend and at least two swing highs and two swing lows that form a horizontal resistance level and an ascending trendline. Traders should watch out for a declining volume as the pattern forms and watch for a strong breakout with significant volume.
A strong breakout where the price closes above the resistance level with high volume is a more reliable and higher possibility that the price will be moving in the expected direction. It is important to watch out for false breakouts in this pattern. The patterns with a lot of white spaces should be avoided and the price should cross the chart several times.
Where to place Target and Stop Loss?
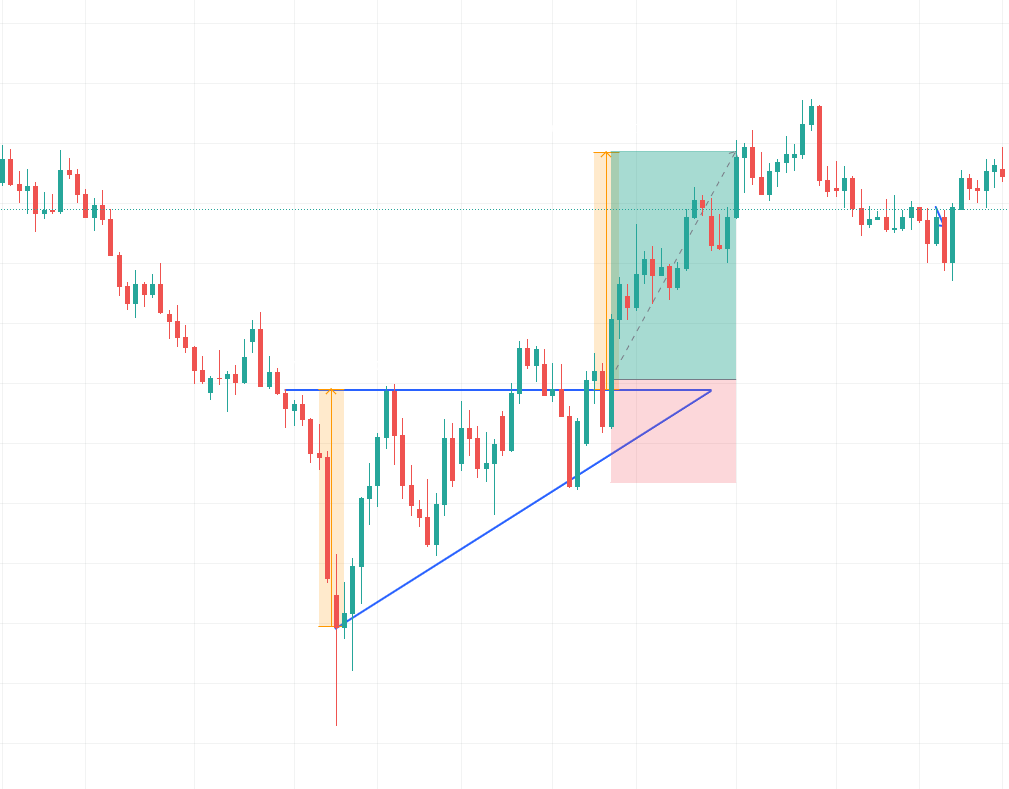
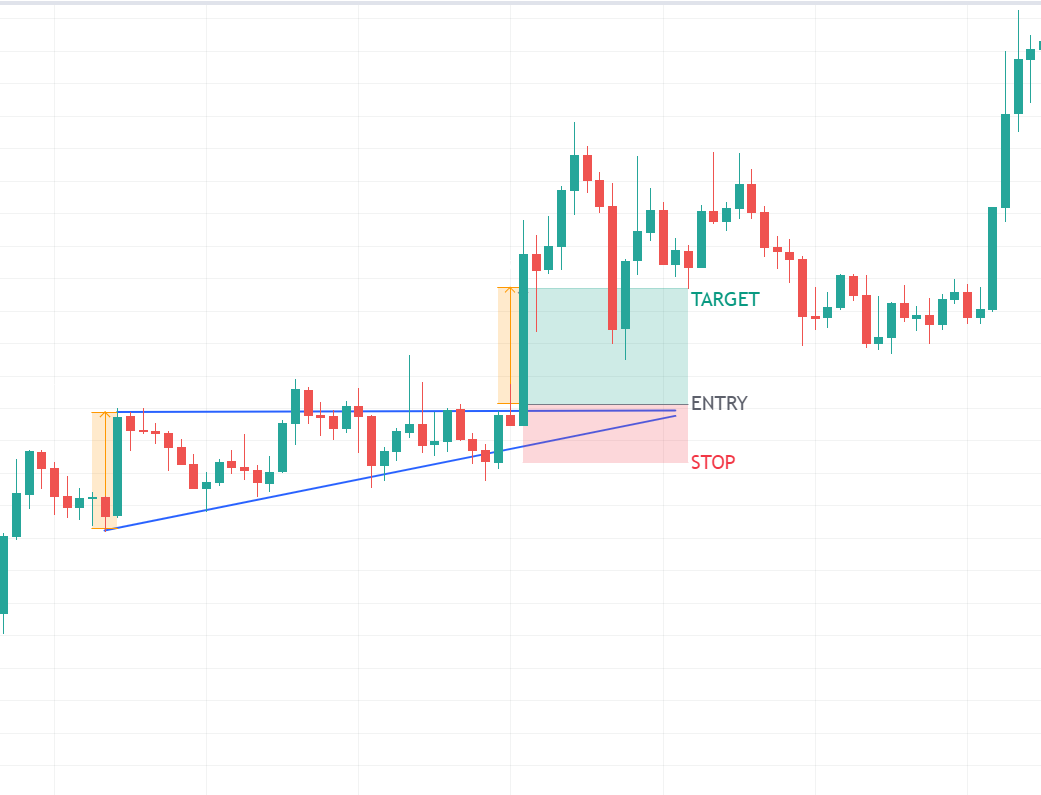
The profit target can be placed by measuring the difference between the widest two points forming the triangle and extending that distance up from the trend line breakout.
Stops are commonly placed below the upwards-sloping side of the triangle pattern. This should yield around 2R trade (for every 1 unit of risk we expect 2 units of reward).
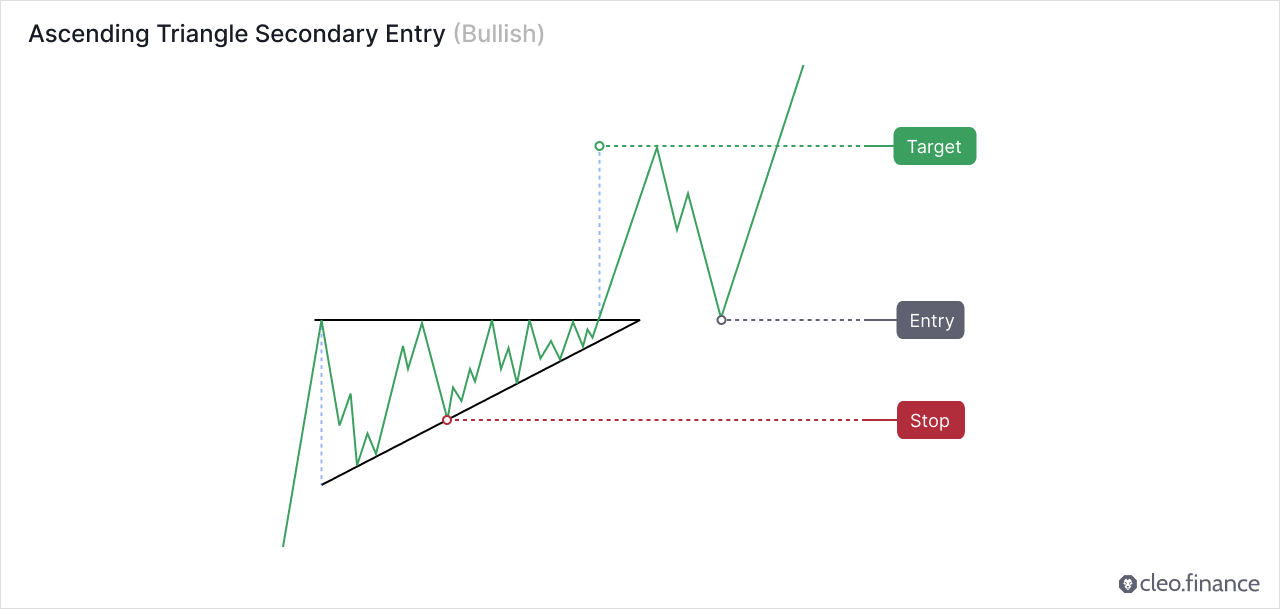
According to Thomas Bulkowski’s research, the pullback/throwback rate for an ascending triangle pattern is typically high. Approximately 6/10 times, the price will retrace back to either the breakout point or the apex point of the pattern. This means that there is a significant chance that the price will retest the triangle’s resistance line before continuing the move. This retracement tends to negatively impact the pattern’s performance. Traders should keep an eye out for it when considering entry and exit points.
How to trade an Ascending Triangle Pattern automatically as a crypto bot?
Using trendline trading tools within the trading chart on cleo.finance, you can identify and draw ascending triangle chart patterns effortlessly. Once you’ve identified the pattern, you can easily automate your trading strategy by selecting the trendlines you’ve drawn as your entry and exit conditions. It allows you to take advantage of potential breakout opportunities when the price moves above the resistance line while limiting your downside risk by exiting the trade if the price drops below the lower trendline along with the advanced risk controls.
Step-by-step guide
1. To identify an ascending triangle chart pattern on the cleo.finance trading chart, you can draw a trendline connecting the horizontal resistance level and the higher lows with an ascending trendline.
2. Once you draw your chart patterns via trendlines, the trendlines will have an auto-generated name that you’ll need to use in the entry or exit conditions. So you can simply start writing your conditions “Price” and then pick the comparison you want. Your drawn trendlines will be available in the drawing> Trendline section.
3. Set your volume and then you can place your stop below the upward-sloping side of the ascending triangle pattern which should yield around 2R trade. Set your target as the same as the height of the rectangular which represents the widest distance of the ascending triangle.
4. All set and now you can hit the deploy live button.
Conclusion
Traders should look for an established uptrend, multiple touches on the top trendline by minor highs, and the bottom trendline by minor lows for the Ascending Triangle Pattern. The pullback/throwback rate for an ascending triangle pattern is typically high, and traders should keep an eye for it when considering entry and exit points. The best results can be achieved by using ascending triangle pattern with other indicators for conforming the breakouts.
Cleo.finance offers a quick and easy way to identify chart patterns with the trendline trading tool. You can draw your chart patterns and set them up as entry and exit conditions. All can be done in a few minutes which allows you to have more time to focus on monitoring, analyzing, and improving your trading success along with utilizing other innovative trading tools available on Cleo.finance.