Chart Pattern Series (2/12): Descending Triangle Pattern7 min read
Chart patterns are a powerful tool that can help you make more informed trading decisions by providing crucial insights into market dynamics, the behavior of buyers and sellers in the market, and a better understanding of potential price movements. In this 2nd article of the chart pattern series, we will be exploring the Descending Triangle Pattern.
If you haven’t already be sure to check out the other series!
- Symmetrical Triangle Pattern
- Ascending Triangle Pattern
- Pennant Chart Pattern
- Rising Wedge Chart Pattern
- Falling Wedge Pattern
- Bull Flag Pattern
- Bear Flag Pattern
Table of Contents
What is the Descending Triangle Pattern?
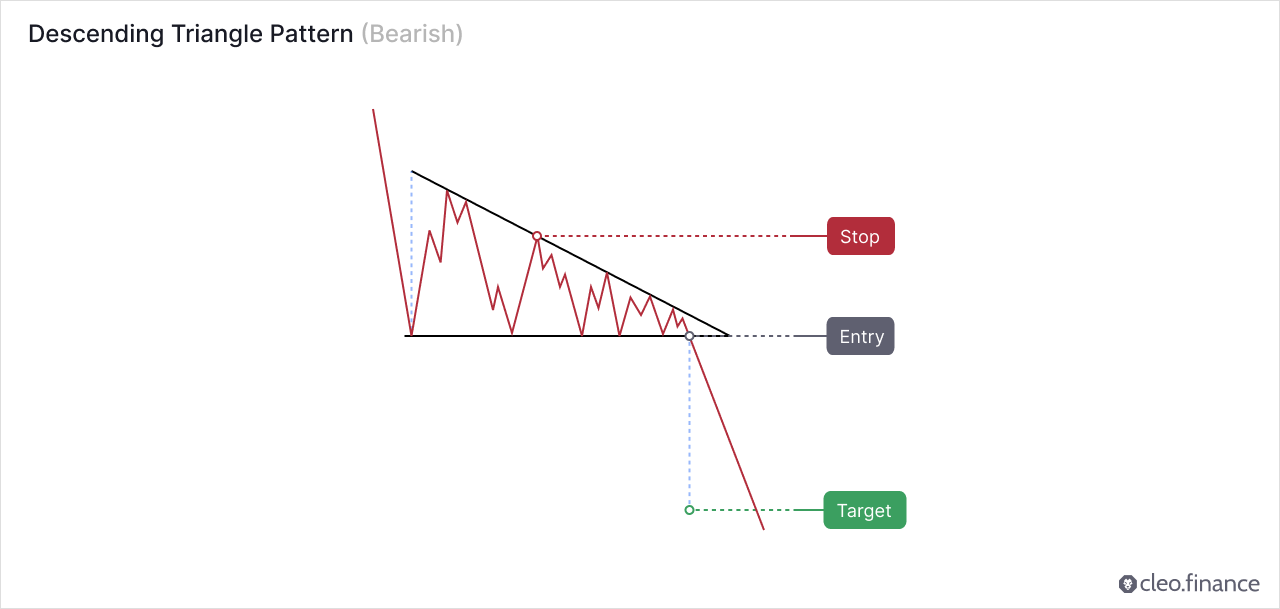
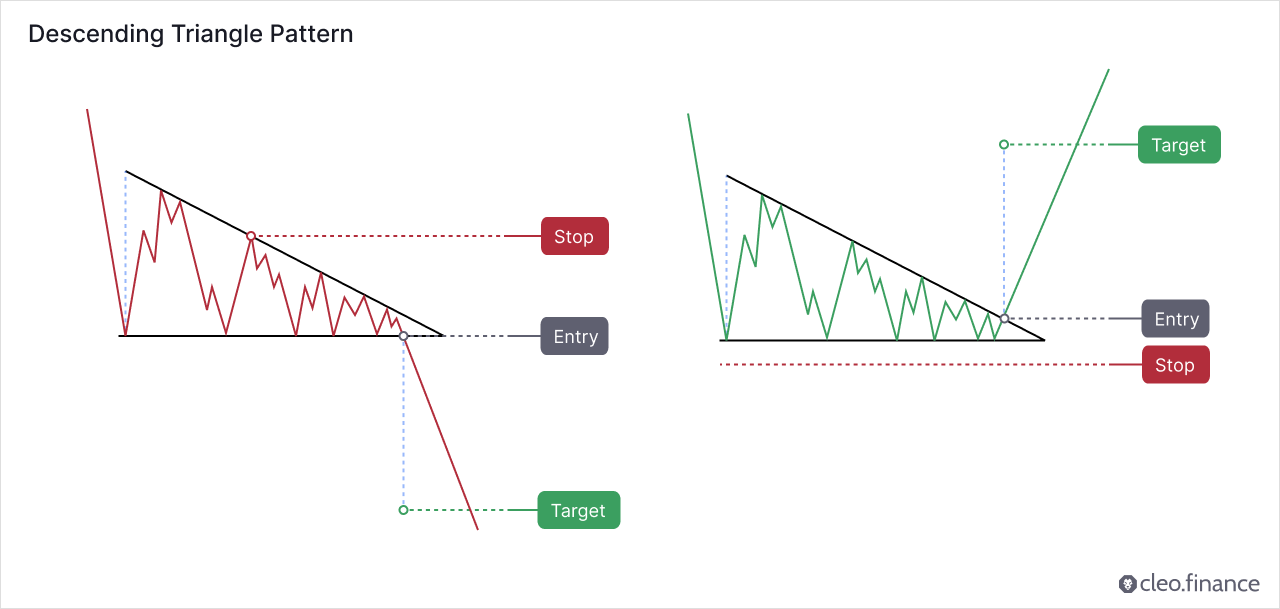
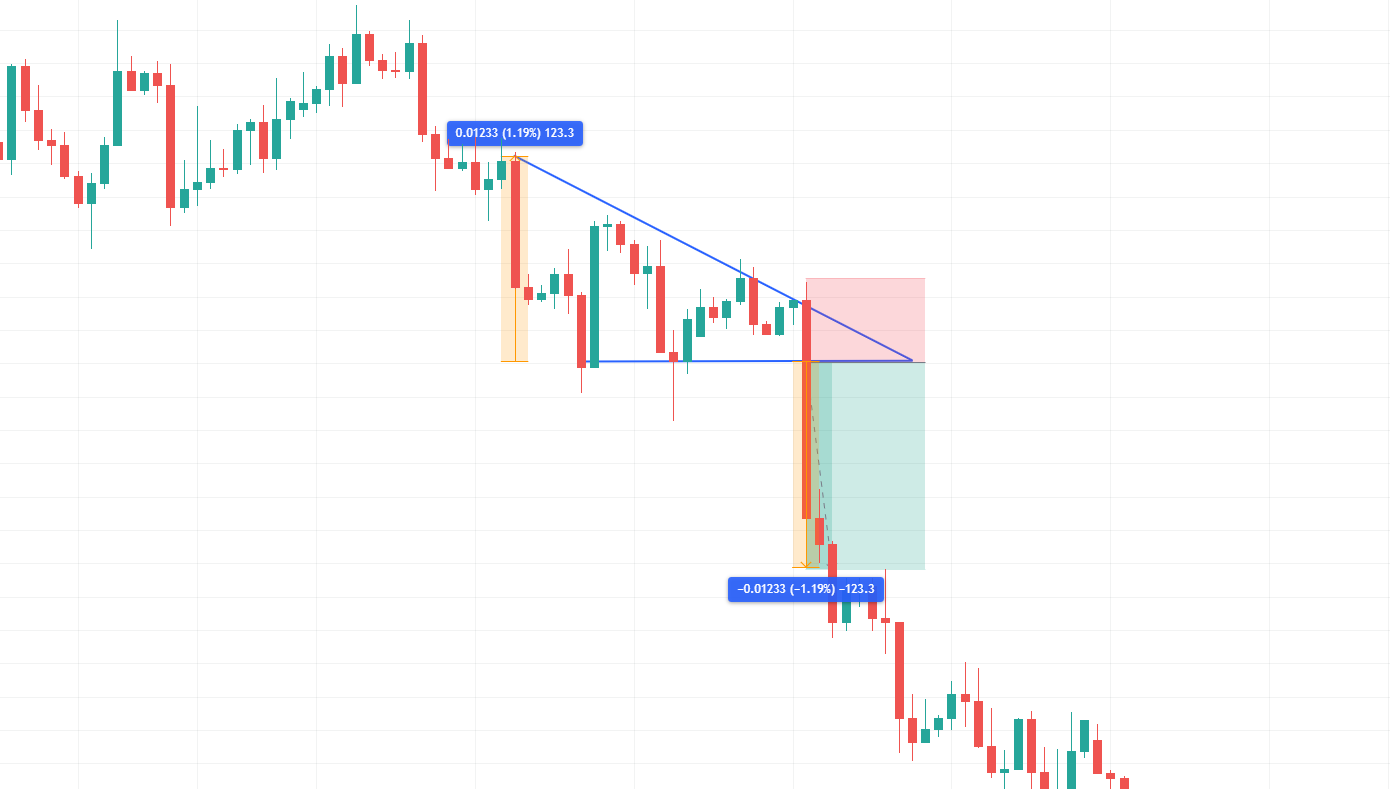
The descending triangle chart pattern is generally a bearish pattern. It forms when the price is making a series of lower highs and testing a horizontal support level multiple times. The pattern is created by connecting the support level with a horizontal line and joining the lower highs with a descending trendline. The breakout is usually to the downside (64%).
To confirm the validity of the descending triangle pattern, the price should touch the support level at least twice and should generally fill the triangles space. The bears are in control during the pattern since they are able to push the price down to the support level and absorb the buyers more effectively each time.
Is Descending Triangle a Continuation or Reversal Pattern?
The descending triangle chart pattern is more commonly a bearish continuation pattern, but there are some occasions where they can signal a reversal. While a downward direction is more likely to happen, it is crucial to approach the pattern with neutrality until a clear breakout is confirmed.
Thomas Bulkowski conducted the most comprehensive publicly available research on chart patterns. He analyzed daily data on US equities and identified more than 1,300 trades based on the breakout of the descending triangle chart pattern. Even though this pattern used to outperform its ascending version, updated data indicate that the descending triangle chart pattern’s performance has significantly declined over the past few decades. Its effectiveness nearly halving since the 1990s, as reported by Bulkowski. According to Bulkowski’s tested chart patterns, the Descending triangle chart pattern ranks 33rd out of 39 patterns for upward breakouts and 15th out of 36 patterns for downward breakouts.
How to identify a good Descending Triangle Pattern?
The descending triangle pattern can be difficult to recognize as it can be stretched high and wide sometimes and could be loaded with false intrabar breakouts. However, when the price eventually breaks out of the pattern, it can result in significant gains. It’s important to monitor the price action closely after entering a trade based on the pattern’s breakout.
For a good descending triangle pattern, look for a clear downward trend leading up to a pattern with a horizontal support level and a descending trendline. The pattern you identified should have declining trading volume since the price consolidates within the pattern. It is because the pattern indicates a period of consolidation and a decrease in volatility.
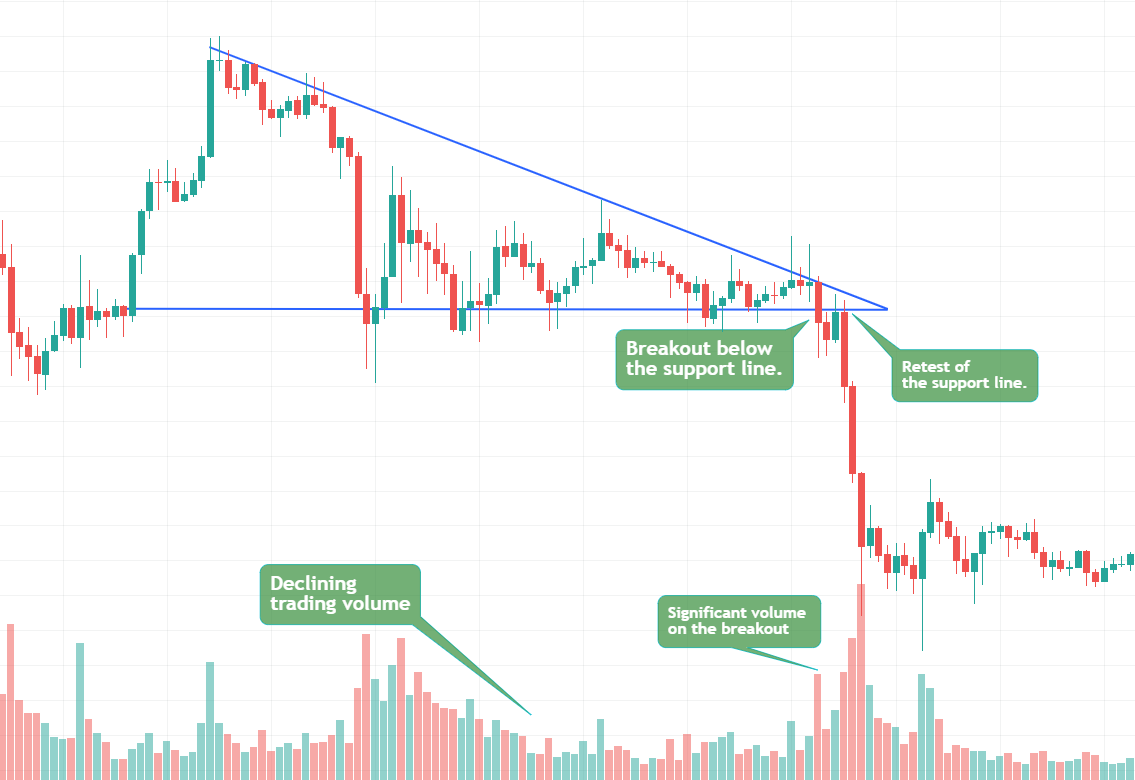
In order to confirm the descending triangle pattern, look for a breakout below the support level on significant volume. And then watch for a retest of the broken support level. It is crucial to note that for a valid pattern, the price should cross from one trendline to another while almost entirely filling the available space and you should avoid descending triangles with abundant white space.
Where to place Target and Stop Loss?
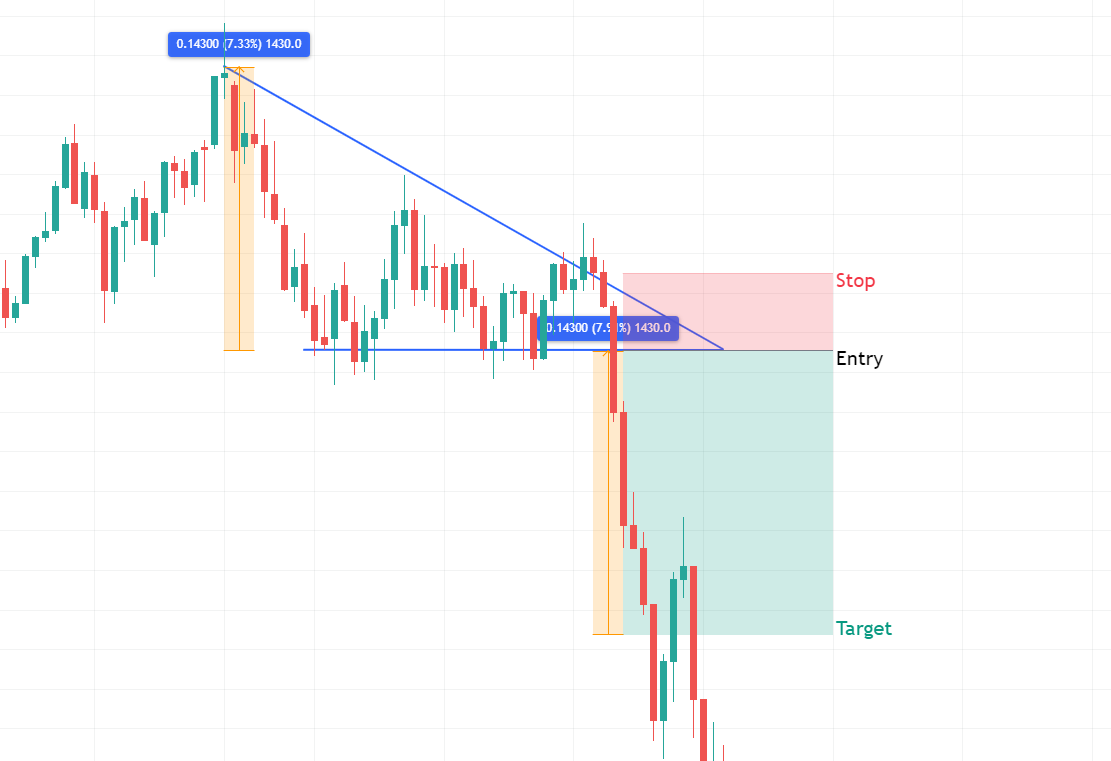
The Target can be set by measuring the widest distance of the triangle to the pattern’s breakout point in the direction of the breakout.
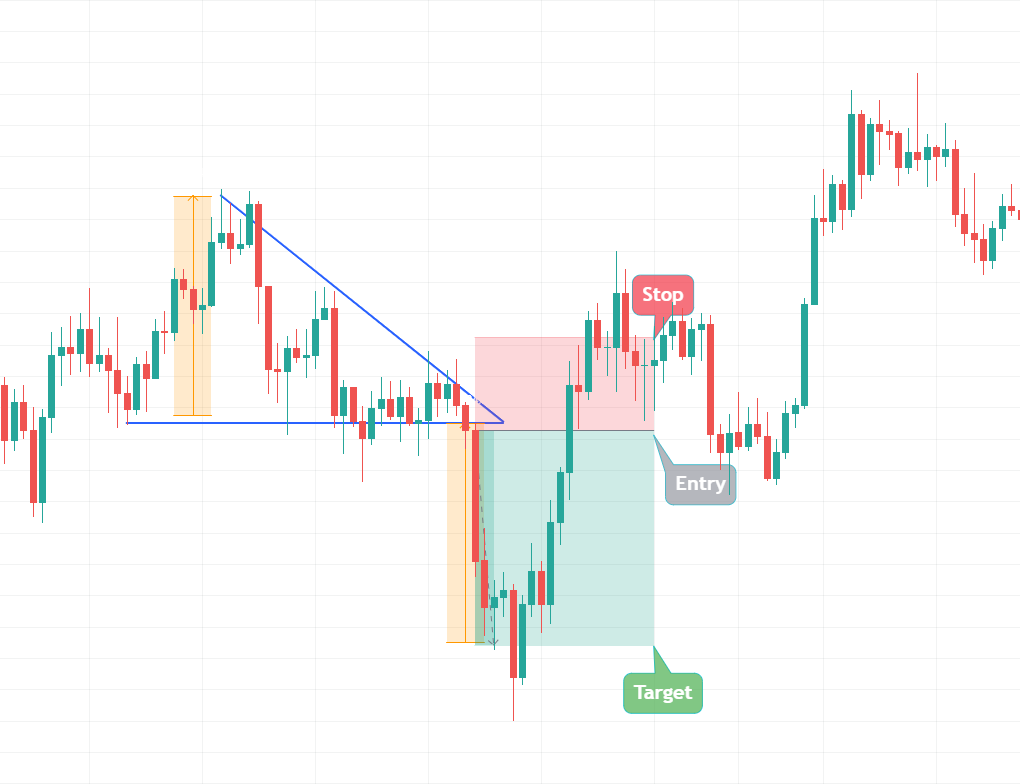
Stops are commonly placed above the downward-sloping side of the descending triangle pattern. This should yield around 2R trade (for every 1 unit of risk we expect 2 units of reward).
Bulkowski states that the pullback/throwback rate back to either the breakout point or the apex point is typically high. Approximately, 6/10 times the price retraces back to the origin and it can impact the pattern’s performance.
How to trade a Descending Triangle Pattern automatically?
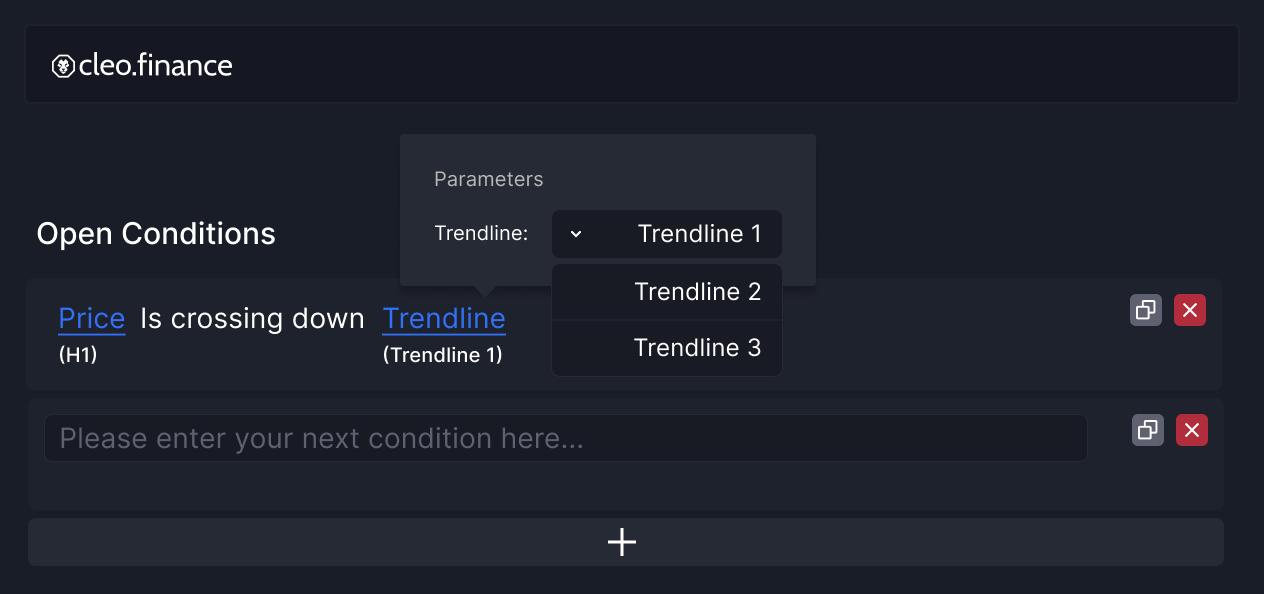
Within the trading chart on cleo.finance, you can easily identify the descending triangle chart patterns and draw them using trendline trading tools. You can then automate your chart patterns with ease by selecting the trendlines you’ve drawn as entry and exit conditions.
Step-by-step guide
1. Identify the chart pattern on the cleo.finance trading chart by drawing the trendlines by connecting the support level and joining the lower highs with a descending trendline.
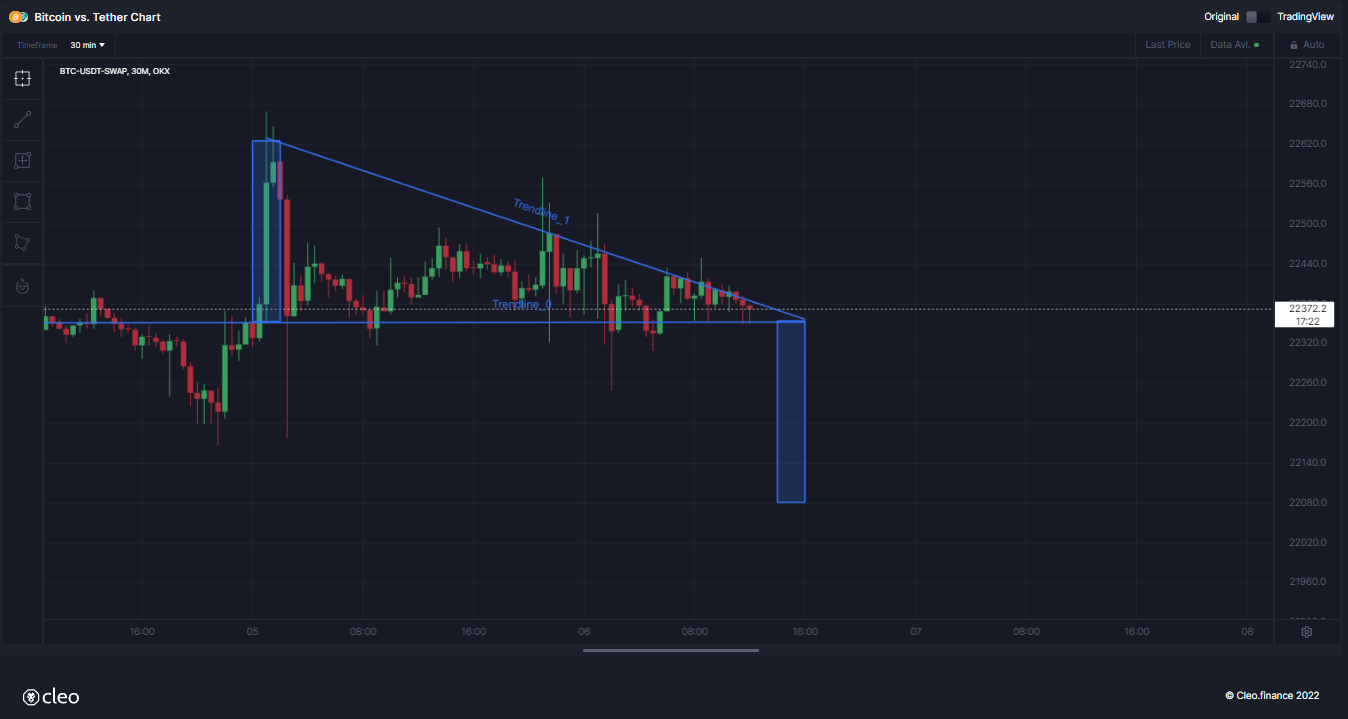
2. Once you draw your chart patterns via trendlines, the trendlines will have an auto-generated name that you’ll need to use in the entry or exit conditions. So you can simply start writing your conditions “Price” and then pick the comparison you want. Your drawn trendlines will be available in the drawing> Trendline section.
3. Set your volume and then you can place your stop above the downward-sloping side of the descending triangle pattern which should yield around 2R trade. Set your target as the same as the height of the rectangular which represents the widest distance of the descending triangle.
4. All set and now you can hit the deploy live button.
Conclusion
The descending triangle chart pattern is usually a bearish pattern formed by a series of lower highs and a horizontal support level. It’s usually a continuation pattern but it can also signal a reversal. It is important to keep in mind that the best results can be achieved in conjunction with other indicators when using the descending triangle pattern – namely decreasing volume have proven to add some predictive power to the pattern.
On Cleo.finance, you can identify chart patterns, draw them with the trendline trading tool, and automate those patterns as entry and exit conditions with ease. All can be done in minutes and you will have more time to monitor, analyze, and increase your trading success with the other innovative trading tools on cleo.finance.