Chart Pattern Series (4/12): Pennant Chart Pattern8 min read
Chart patterns are useful tools for traders to predict potential price movements and make informed trading decisions. Understanding chart patterns is an essential skill that can give you a competitive edge in the trading world. In this fourth article of the chart pattern series, we will be exploring the Pennant Chart Pattern.
If you haven’t already, be sure to check out the previous series:
- Symmetrical Triangle Pattern
- Descending Triangle Pattern
- Ascending Triangle Pattern
- Rising Wedge Chart Pattern
- Falling Wedge Pattern
- Bull Flag Pattern
- Bear Flag Pattern
Table of Contents
What is the Pennant Chart Pattern?
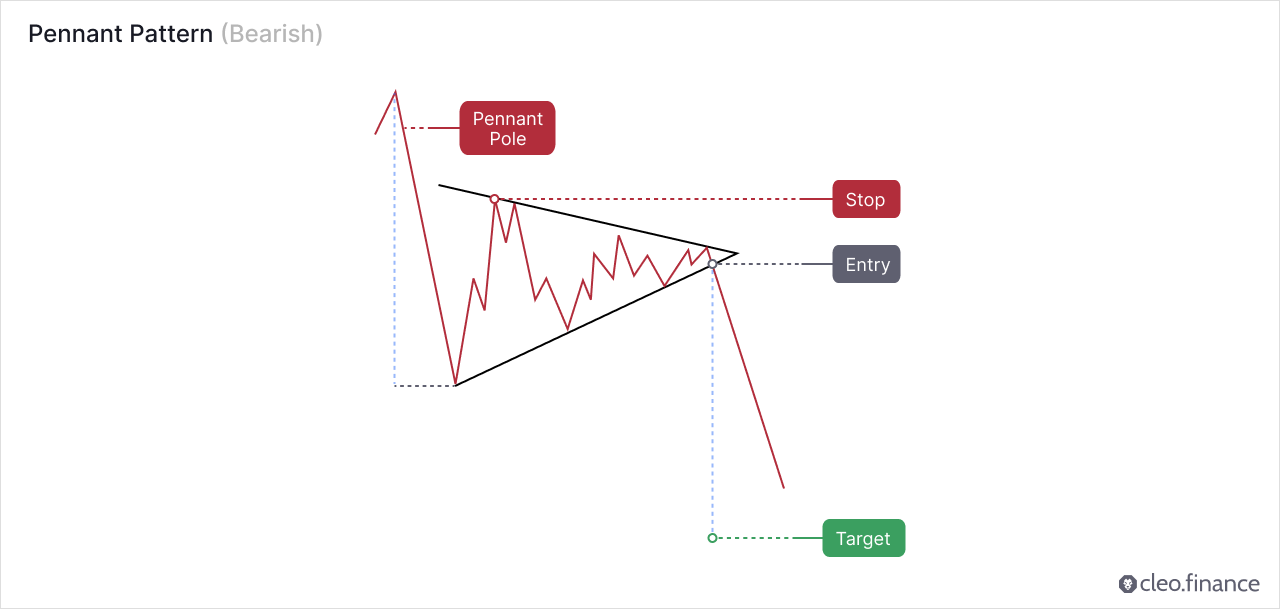
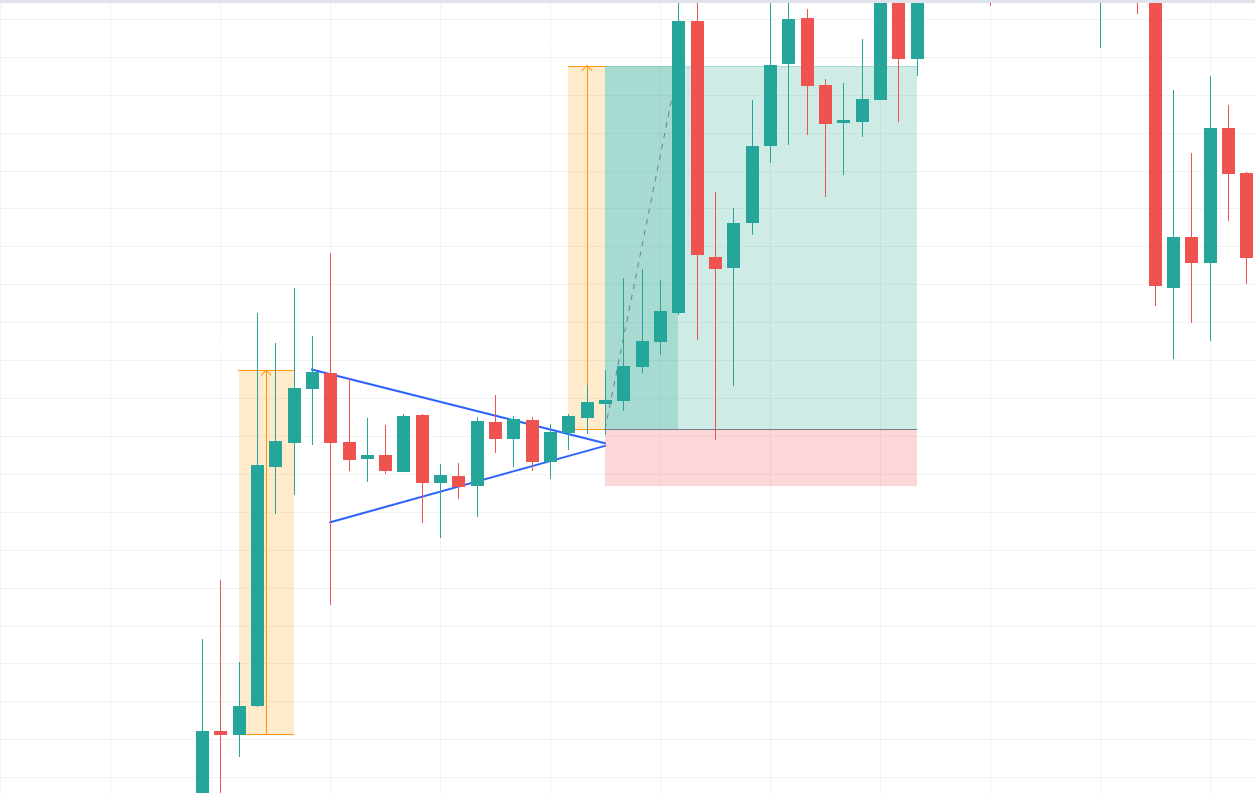
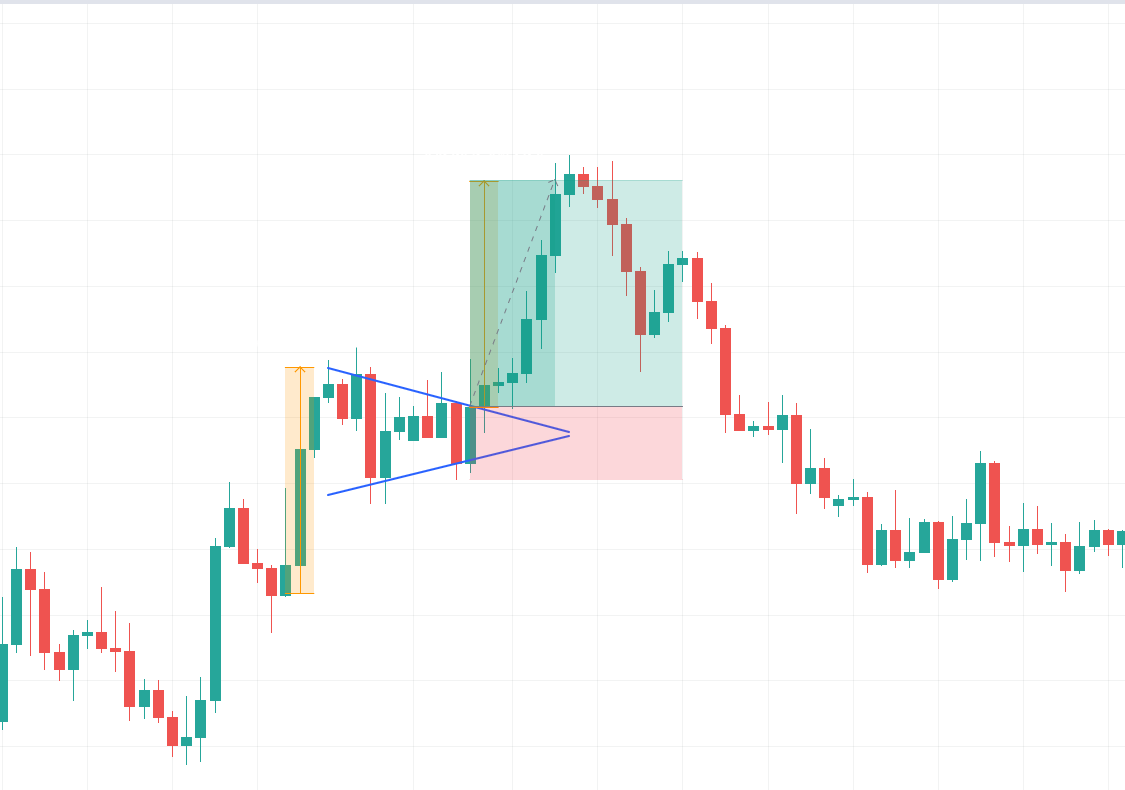
The Pennant Chart Pattern is a short-term continuation pattern. It is formed when there is a downward or upward sharp price movement followed by a consolidation period. Pennant patterns are frequent formations with rapid and reliable outcomes. Once a breakout occurs in either direction of the pattern, price tends to immediately surge forward with minimal pullbacks or throwbacks, and a low probability of failure.
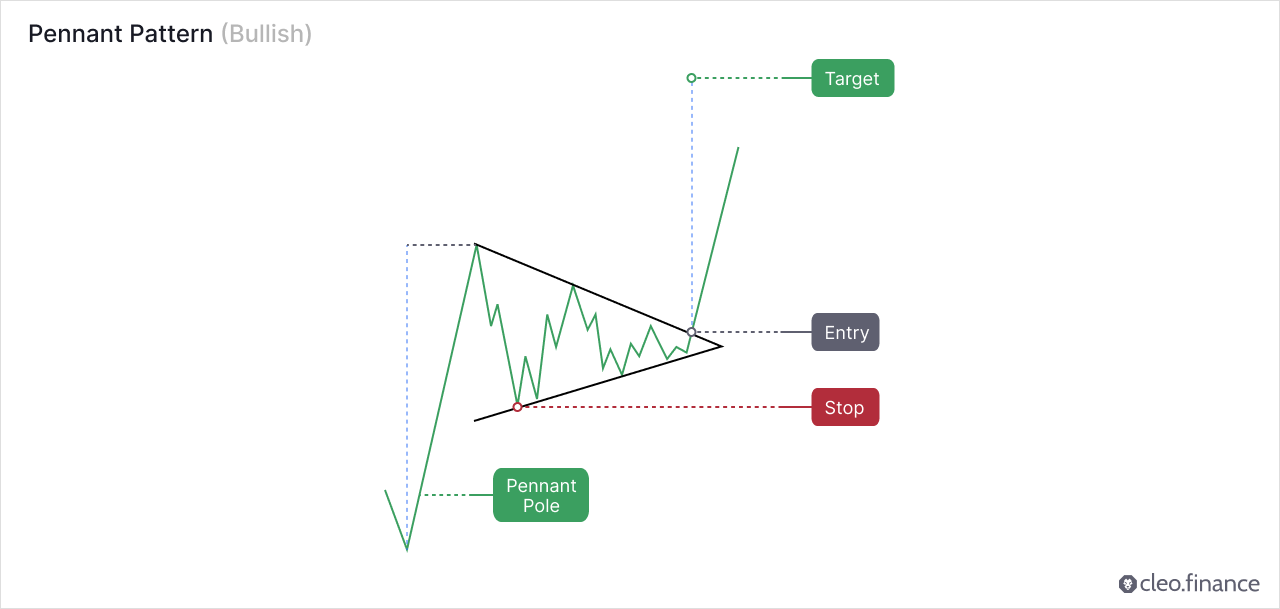
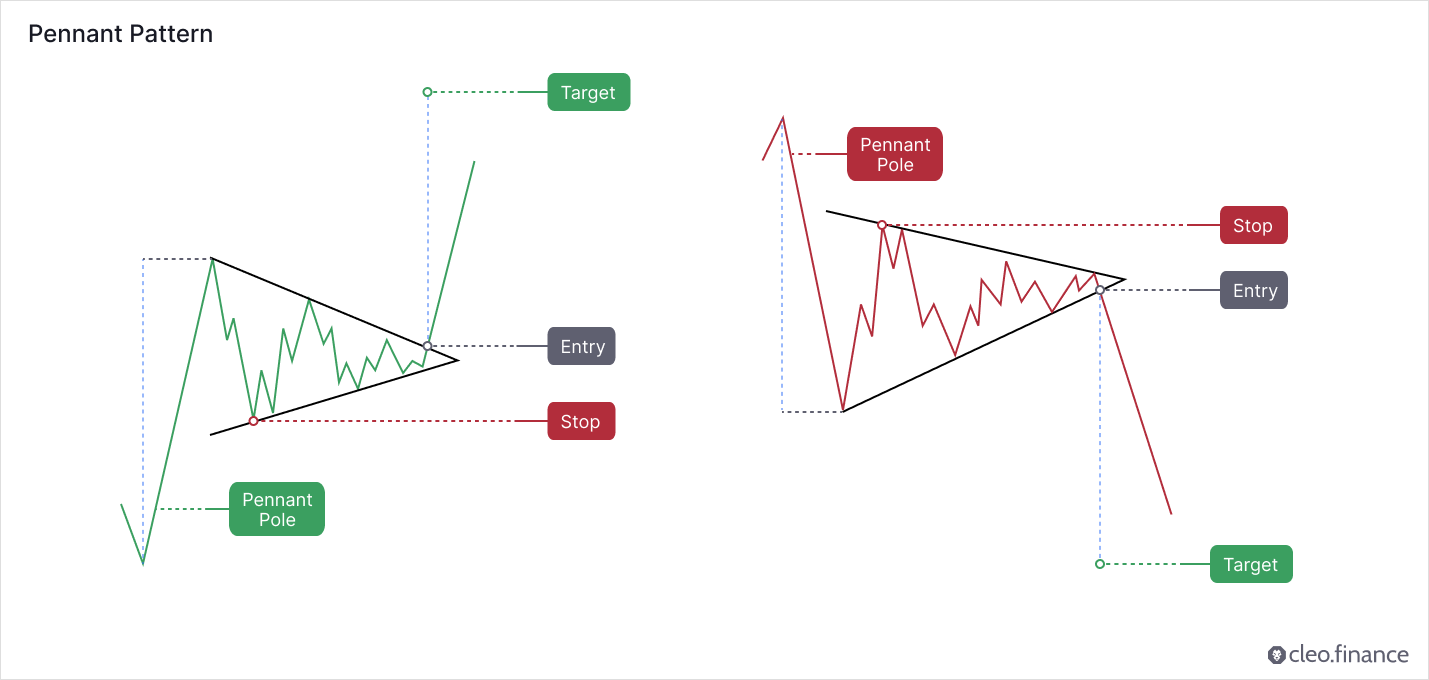
The Pennant chart pattern is a smaller version of the flag chart pattern, but unlike the flag chart pattern, the pennant pattern is formed by a symmetrical triangle pattern, not a rectangular channel. Two sloping trend lines converge and outline a pennant formation, representing a small wedge. Typically the slope of the trendlines is downward in an uptrend and upward in a downtrend.
Is the Pennant Chart Pattern a Continuation or Reversal Pattern?
A pennant pattern is a continuation pattern, which means that it signals a continuation of the previous trend once the consolidation period is over. Breakout from the pattern usually occurs in the direction of the previous trend, and the volume tends to decrease during the consolidation period.
According to Thomas Bulkowski’s research, the pennant pattern has a high overall performance, with a success rate of 68 %. In other words, in 68 % of cases, the trend continues in the same direction after the pennant formation.
How to Identify a Good Pennant Chart Pattern?
To identify a good pennant chart pattern, look for a sharp price movement followed by a consolidation period that forms a small symmetrical triangle pattern. The converging two trend lines should have at least two touches on both the upper and lower trend lines. The slope of the pattern could be upward, downward, or even horizontal. However, it is important to keep in mind that the pennant chart pattern generally slopes against the prevailing price trend.
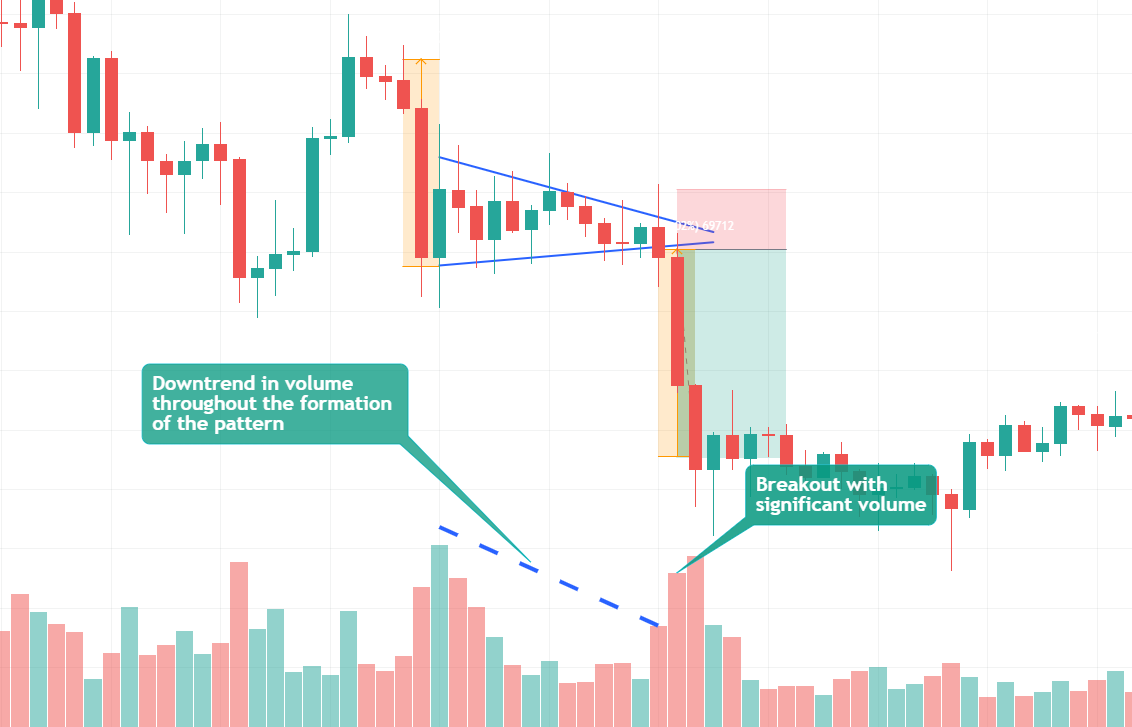
The volume should decrease during the consolidation period, and a breakout should occur in the direction of the previous trend. 90 % of the pennant patterns are characterized by a diminishing volume that has a downward trend throughout the formation of the pattern. The breakout should be accompanied by a significant increase in volume, indicating a strong momentum in the market.

Pennant chart pattern usually lasts between one to three weeks, although some pennants can last longer, up to two months. Pennants that take more than about 15-20 candles to develop are usually classified as symmetrical triangles or wedge chart patterns.
Where to Place Target and Stop Loss?
The target can be placed by measuring the distance from the start of the sharp price movement (the pole of the pennant) to the start of the consolidation period and then applying that distance above the pattern’s breakout point.
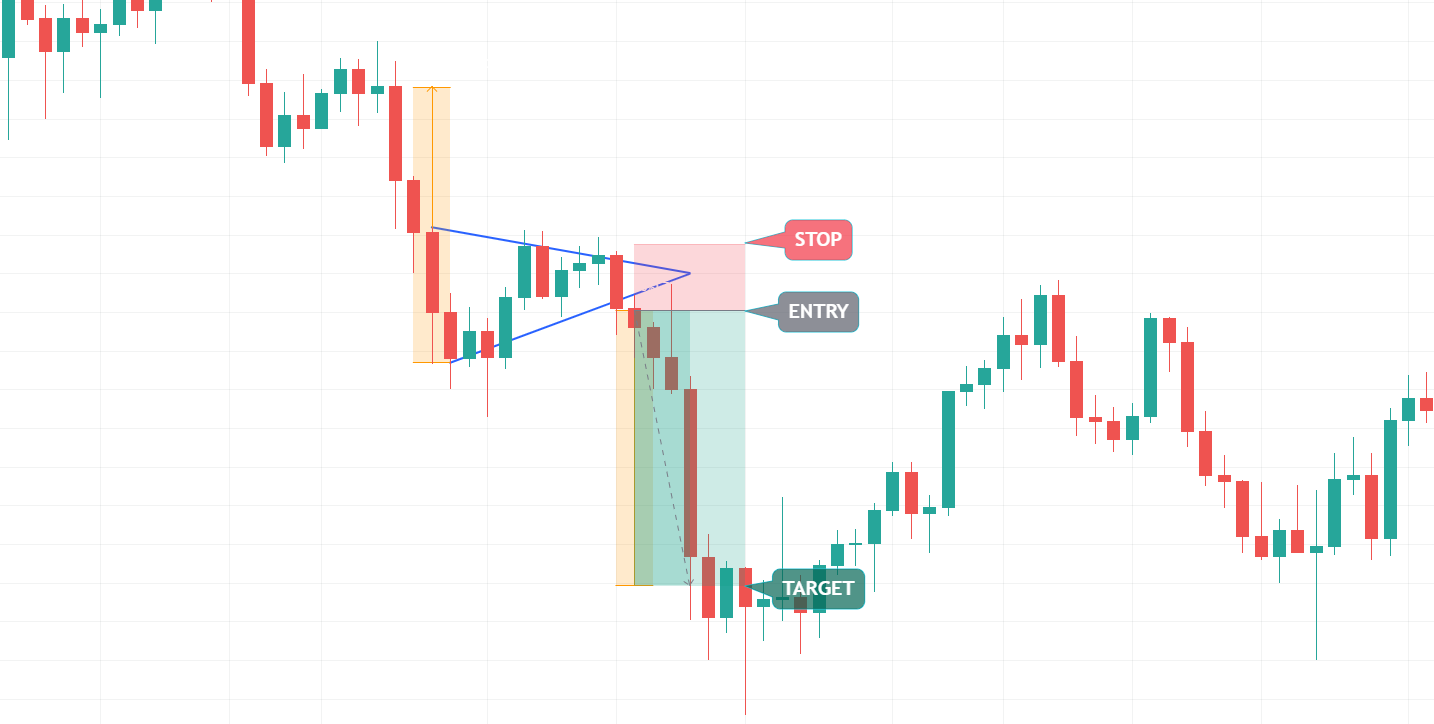
The stop loss can be placed below the lower trend line of the pattern. And you should aim for a risk-to-reward ratio of at least 2R. (for every 1 unit of risk you expect 2 units of reward).
How to Trade a Pennant Chart Pattern Automatically?
Using trendline trading tools within the trading chart on cleo.finance, you can identify and draw pennant chart patterns effortlessly. Once you’ve identified the pattern, you can easily automate your trading strategy by selecting the trendlines you’ve drawn as your entry and exit conditions. It allows you to take advantage of potential breakout opportunities when the price moves above or below the trendline while limiting your downside risk by exiting the trade if the price moves in the opposite direction of the breakout.
Step-by-step Guide
1. Identify your Pennant Chart Pattern on cleo.finance trading chart and draw trendlines that converge where it should have at least two touches on both the upper and lower trend lines.
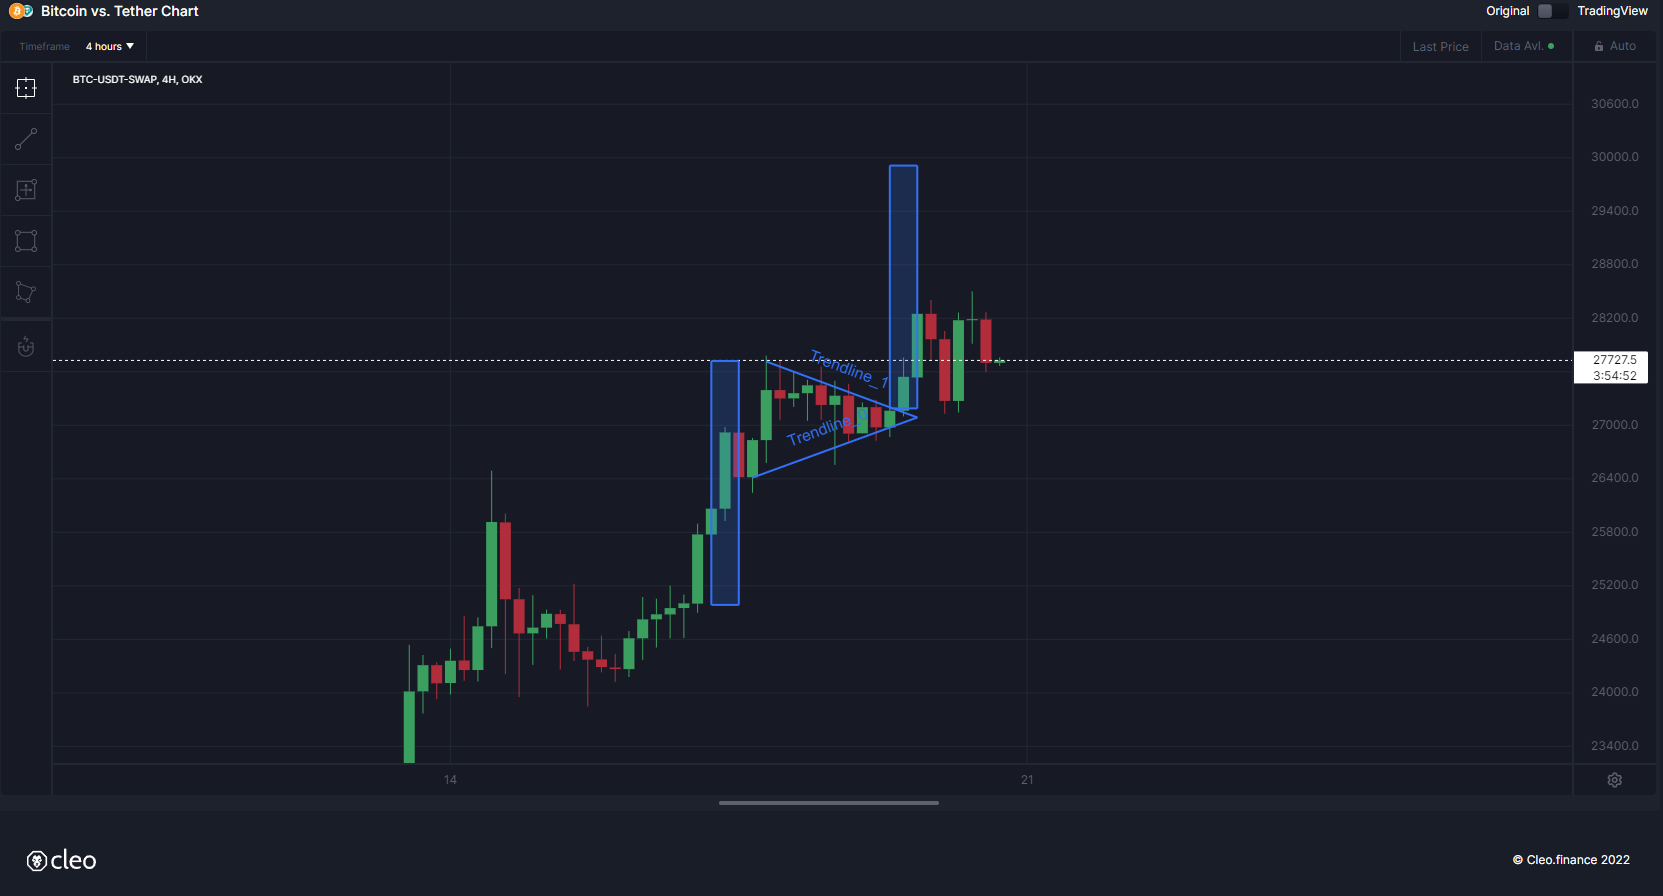
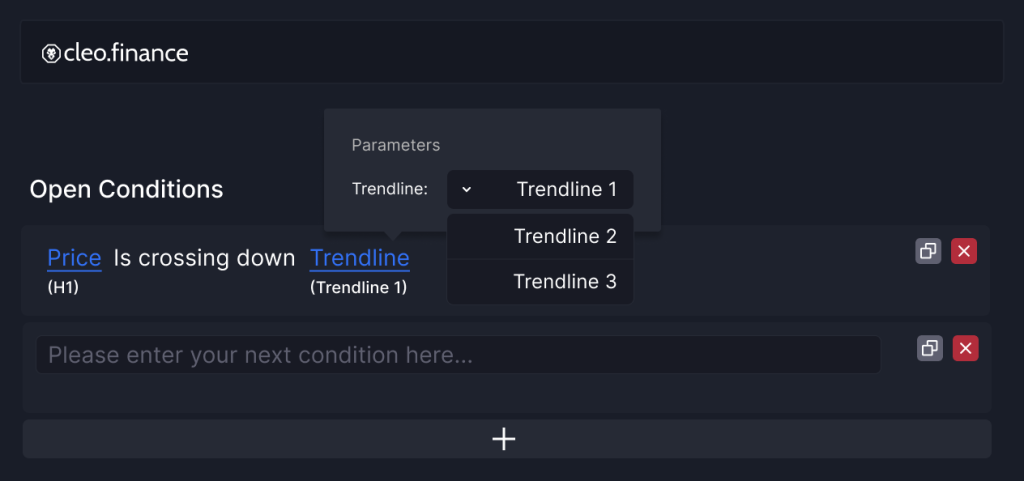
2. Once you draw your chart patterns via trendlines, the trendlines will have an auto-generated name that you’ll need to use in the entry or exit conditions. So you can simply start writing your conditions “Price” and then pick the comparison you want. Your drawn trendlines will be available in the drawing> Trendline section.
3. Set your volume and then you can place your stop below the lower trend line of the Pennant Chart Pattern with around 1:2 RR (Risk to reward ratio). Set your target by measuring the distance between the beginning of the strong price movement (known as the pole) and the start of the consolidation period, and then added to the breakout point above the pennant pattern.
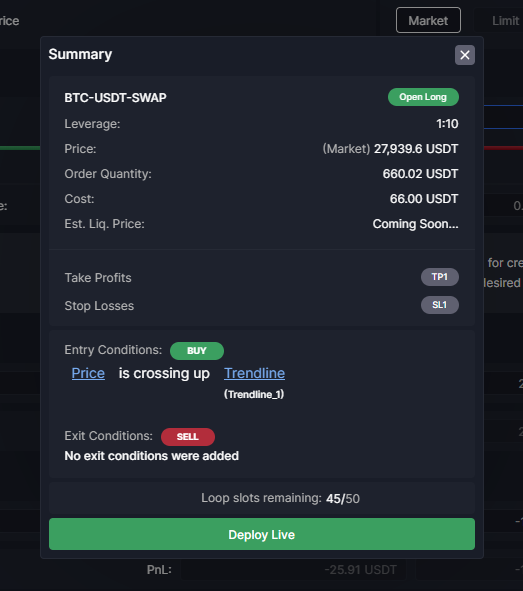
4. All set and now you can hit the deploy live button.
Conclusion
Traders should look for a sharp price movement followed by a consolidation period, with converging trendlines that have at least two touches on both the upper and lower trendlines. A breakout in the direction of the previous trend was accompanied by a significant increase in volume for the pennant chart pattern. It is important to keep in mind that, Pennant chart patterns are mostly characterized by a downtrend in volume. To achieve the best results, pennant chart patterns should be used in conjunction with other indicators.
Cleo.finance’s trendline trading tool empowers you to easily fine-tune your trading strategies. You can identify chart patterns and draw trendlines right on the chart, and integrate them into your automated trading system. You can combine your identified chart patterns with over 55 technical indicators which can provide you the best results that allow you to make more informed trading decisions.