
Chart Pattern Series (6/12): Falling Wedge Pattern7 min read
Chart patterns are powerful tools that can aid traders in understanding market behavior and predicting price movements, giving them an edge in the market and improving their trading strategies. In this 6th article of the chart pattern series, we will be exploring the Falling Wedge Pattern. As you will see from the examples you can use this pattern when trading forex, crypto or stocks.
If you haven’t already, be sure to check out the previous series:
- Symmetrical Triangle Pattern
- Descending Triangle Pattern
- Ascending Triangle Pattern
- Pennant Chart Pattern
- Rising Wedge Chart Pattern
- Bull Flag Pattern
- Bear Flag Pattern
Table of Contents
What is a Falling Wedge Pattern?
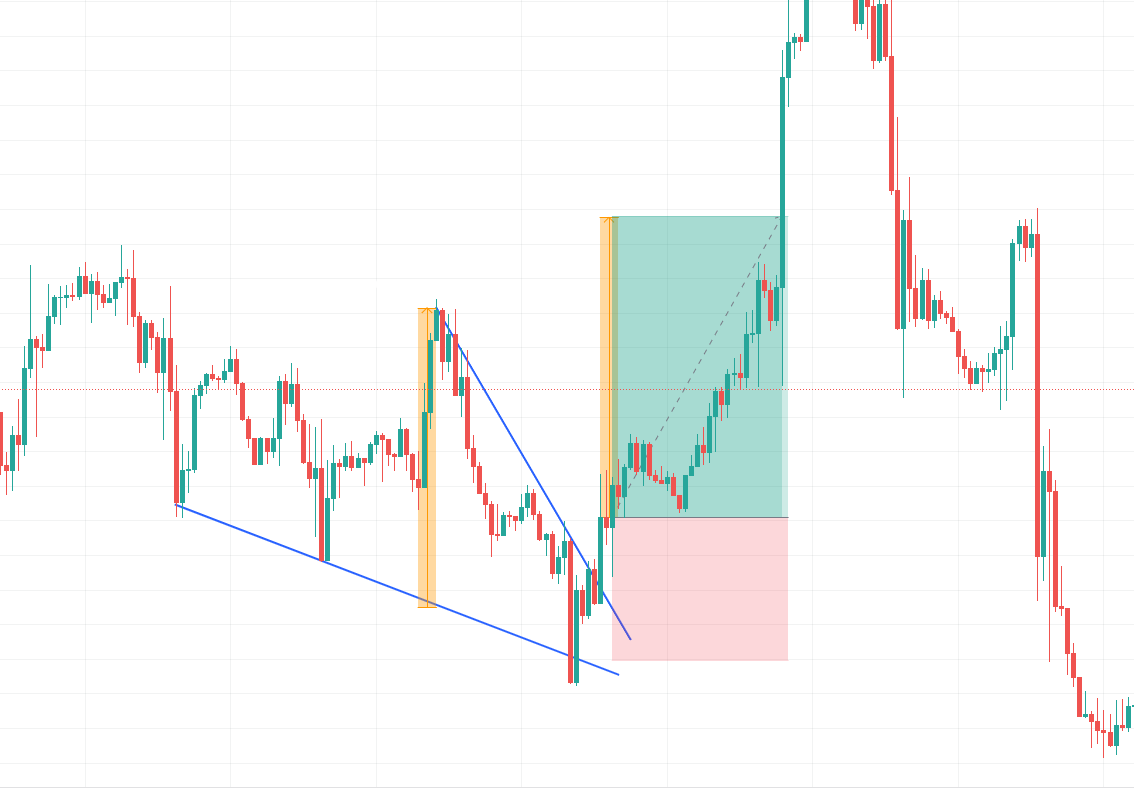
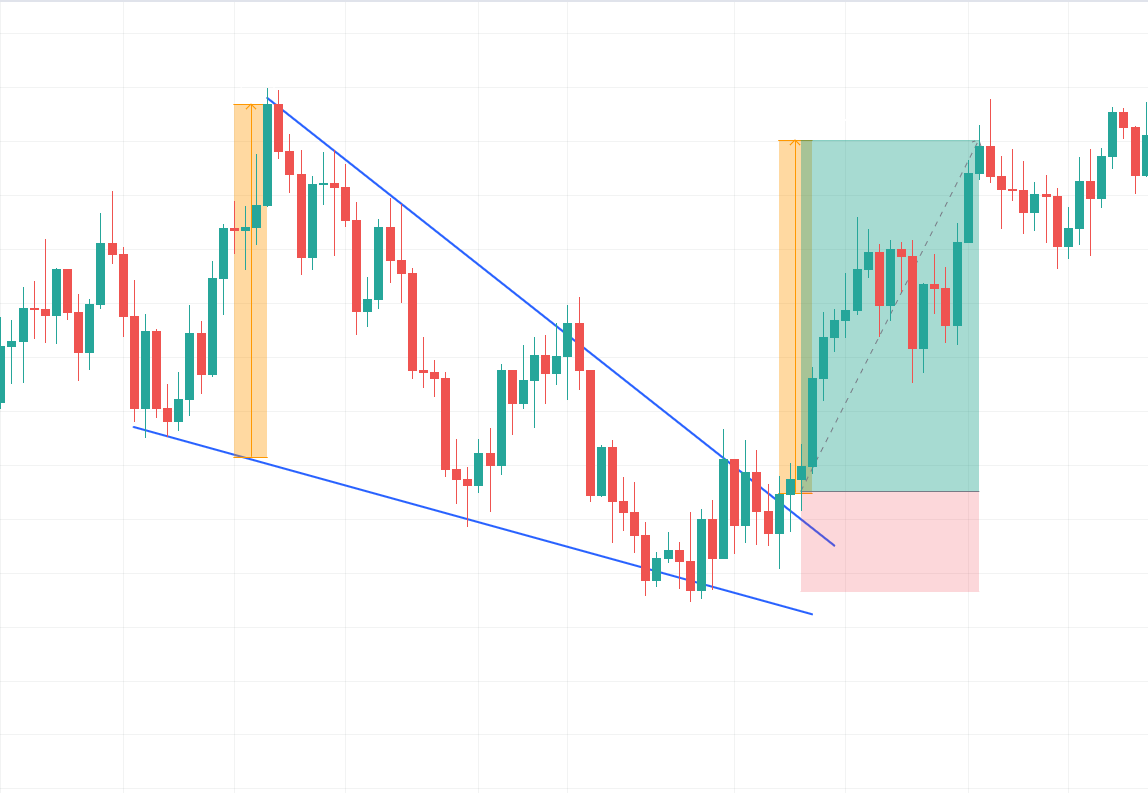
A falling wedge pattern forms during a downtrend when price consolidates between two downward converging support and resistance lines. Falling wedge patterns are characterized by a series of lower lows and lower highs that converge to form a wedge shape.
The falling wedge pattern is basically the opposite of the rising wedge pattern. This means that falling wedge pattern also usually leads to breakouts. While rising wedge often leads to bearish moves, falling wedge often leads to bullish moves. You can notice that the downward moves are getting shorter and shorter on the image above this indicates that bullish move is forming.
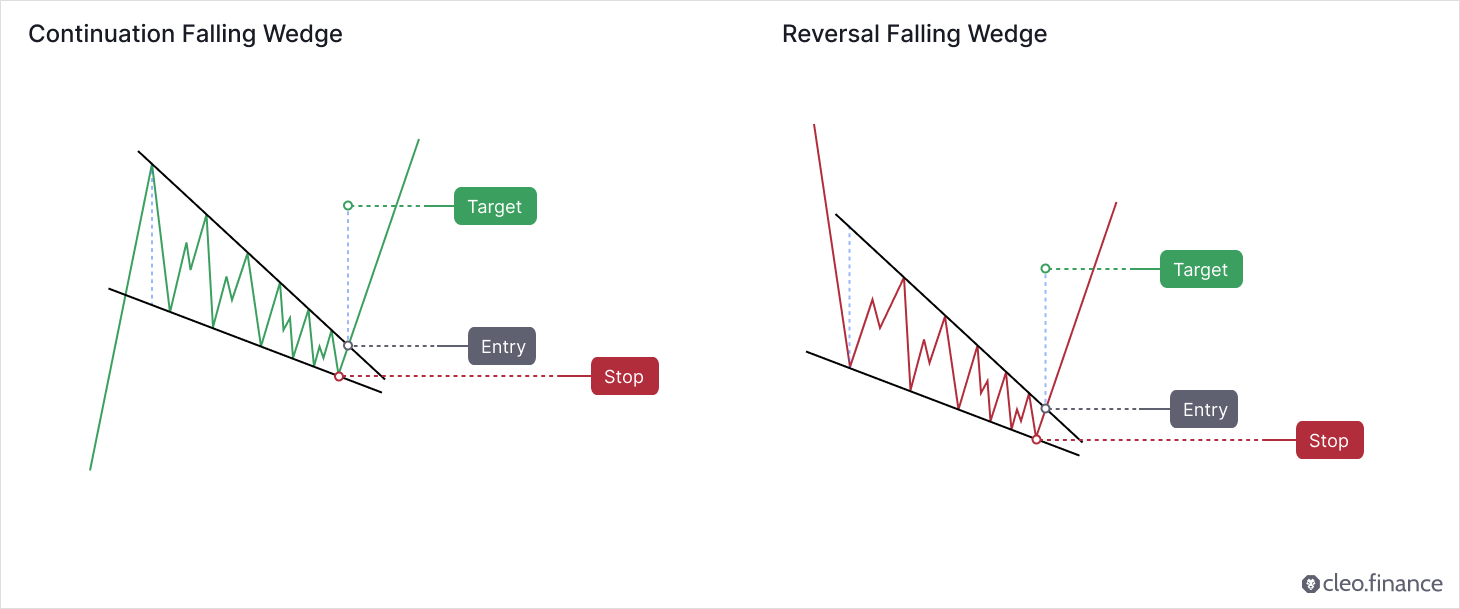
Is the Falling Wedge Pattern a Continuation or Reversal Pattern?
Falling wedge can signal either a reversal or a continuation of the price trend, with both scenarios occurring almost equally often. Usually, upward breakouts in falling wedge patterns indicate a reversal in the price trend, while downward breakouts favor a continuation of the trend. On the other hand, reversals tend to outperform continuations.
Thomas Bulkowski is known for conducting one of the most comprehensive publicly available studies on chart patterns. He analyzed daily data on US equities and identified over 1,400 trades based on the breakout of the falling wedge pattern. Performance-wise, when compared to other chart patterns, the failure rate is a bit high except for downward breakouts in a bear market. The pattern ranked 31st out of 39 chart patterns for upward breakouts and 27th out of 36 chart patterns for downward breakouts.
How to Identify a Good Falling Wedge Pattern?
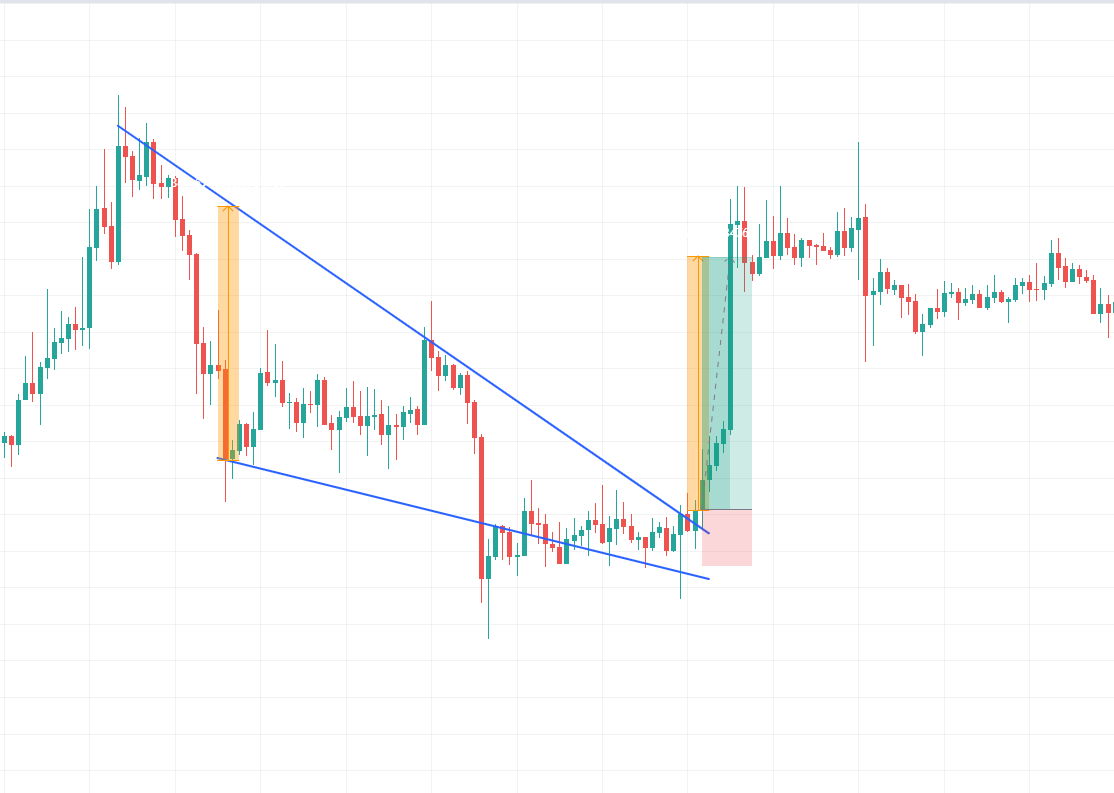
To identify a good falling wedge pattern, look for two downward-sloping trendlines that form a wedge shape. The upper trendline should be steeper than the lower trendline, and tall or wide patterns tend to perform better than short or narrow ones.
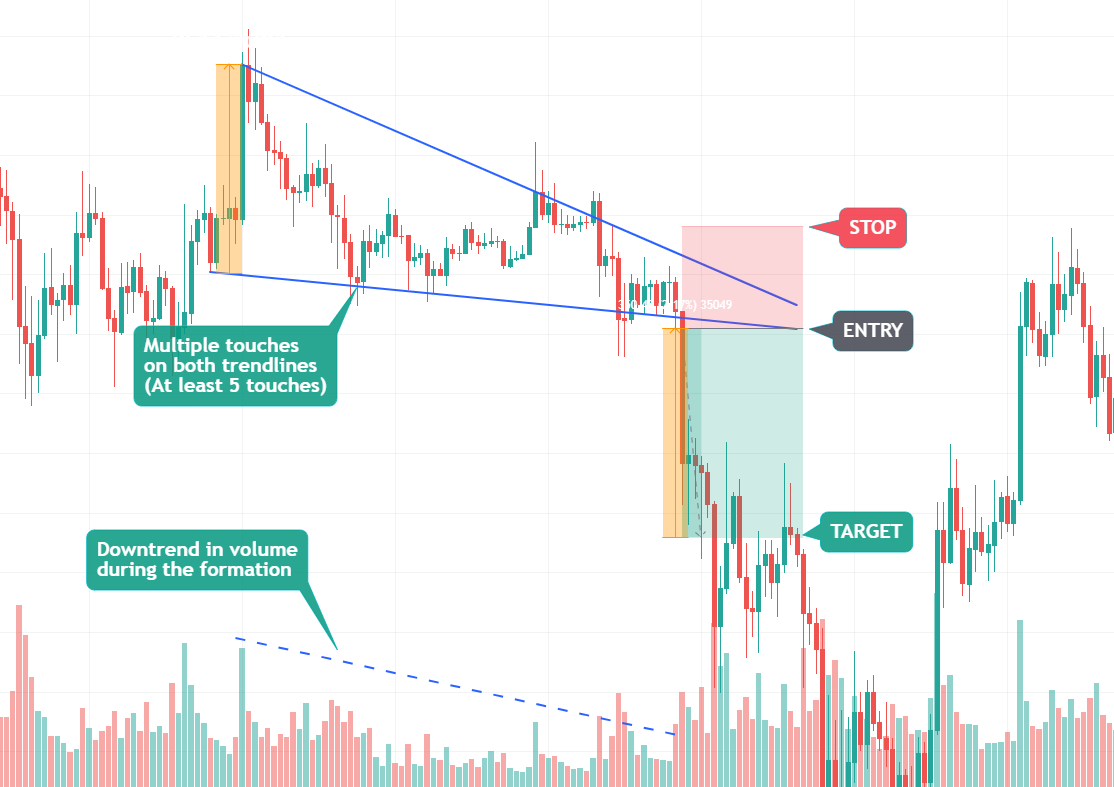
The most common approach to identifying the pattern is to look for at least five touches. Requiring at least five touches helps to avoid mistakenly identifying a price pattern that looks like a gradual rise and fall as a falling wedge. Diminishing trading volume during the formation of the falling wedge is a common characteristic in both consolidation and reversal scenarios.
Where to Place Target and Stop Loss?
The target for a falling wedge pattern can be placed by measuring the height of the wedge at its widest point and extending that distance up from the trend line breakout.
Stops are commonly placed below the bottom of the falling wedge. And you should aim for a risk-to-reward ratio of at least 2R (for every 1 unit of risk you expect 2 units of reward).
According to Thomas Bulkowski’s research, the pullback/throwback rate for a falling wedge pattern is typically high. About 7/10 times, the price will retrace back to either the breakout point or the apex point of the pattern. This indicates that most likely the price will retest the wedge’s resistance line before continuing the movement which could affect the pattern’s performance. Traders should bear this in mind while determining their entry and exit points.
How to Trade a Falling Wedge Pattern automatically or as a crypto bot?
Using the trendline trading tool on Cleo.finance, you can quickly spot and draw rising wedge patterns right on the trading chart. Once you identify the pattern, you can take advantage of automation to execute your trading strategy by setting trendlines as your entry and exit conditions. It allows you to take advantage of potential breakout opportunities when the price moves above or below the trendline while limiting your downside risk by exiting the trade if the price moves in the opposite direction of the breakout.
Step-by-step Guide
1. Identify your pattern on cleo.finance trading chart – two downward converging support and resistance lines.
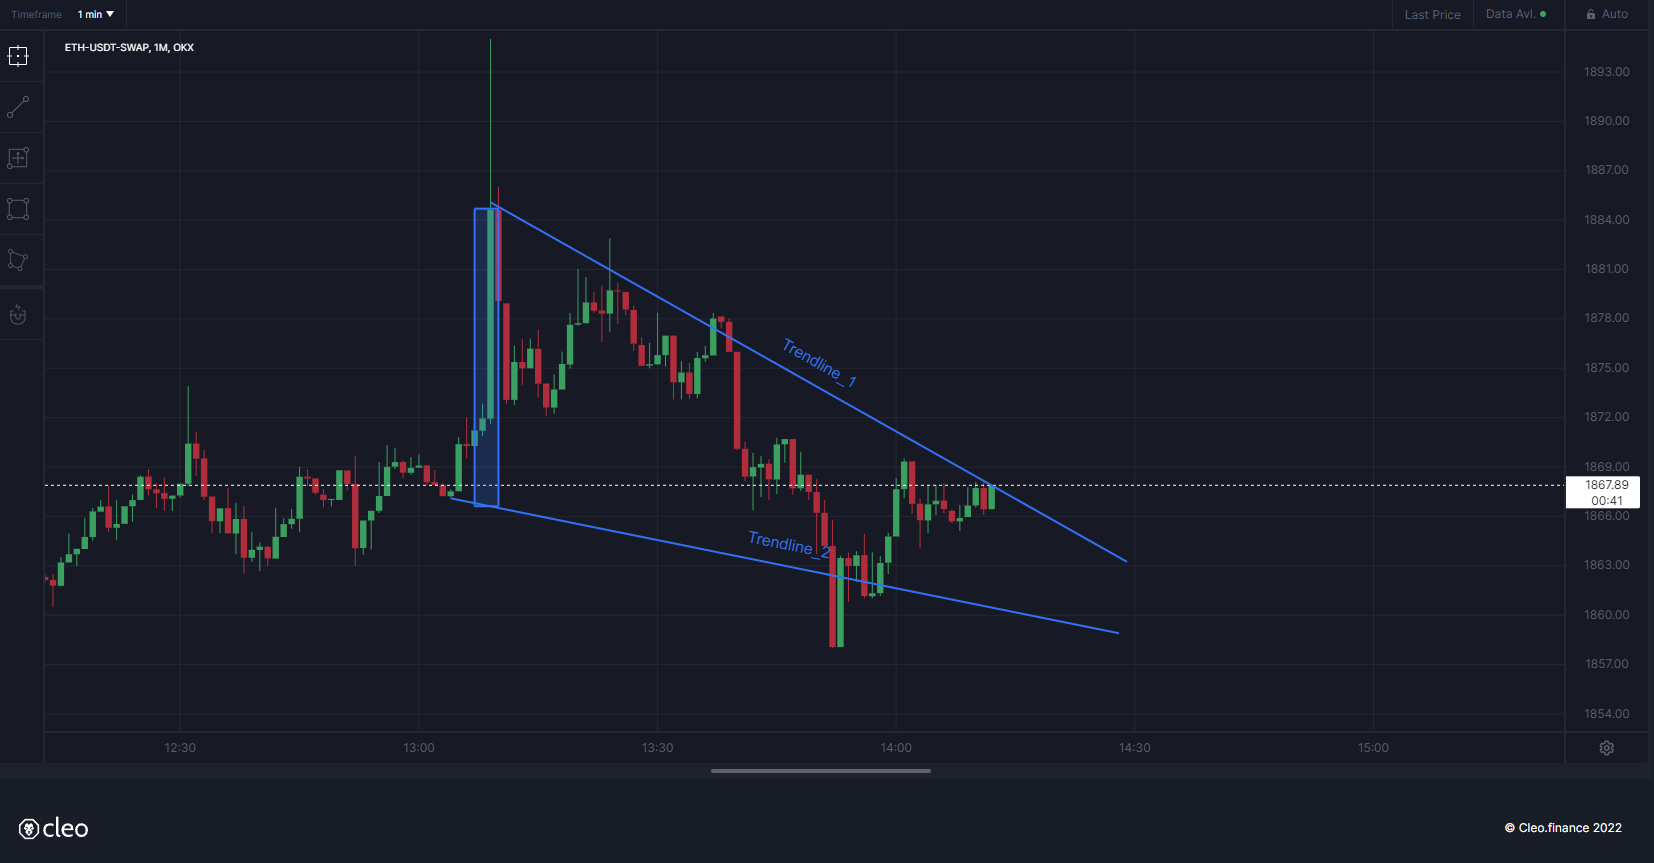
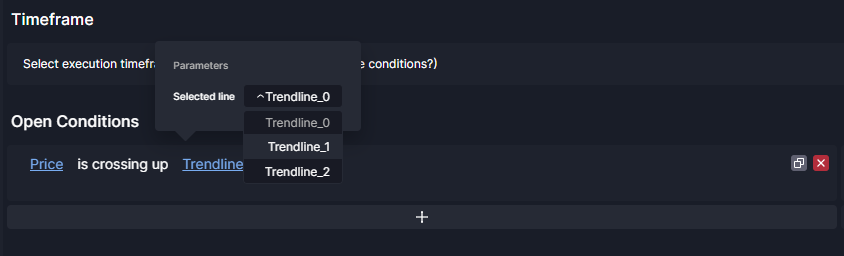
2. Once you draw your chart patterns via trendlines, the trendlines will have an auto-generated name that you’ll need to use in the entry or exit conditions. So you can simply start writing your conditions “Price” and then pick the comparison you want. Your drawn trendlines will be available in the drawing> Trendline section.
3. Set your volume and then you can place your stop below the bottom side of the falling wedge with around 1:2 RR (Risk to reward ratio). Set your target at the same height as the widest point of falling wedge.
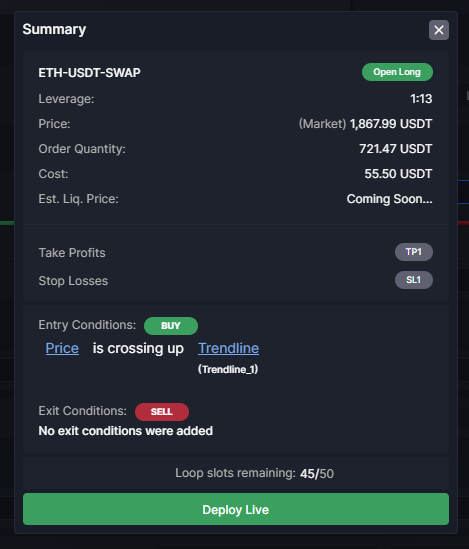
4. All set and now you can hit the deploy live button.
Conclusion
Traders can identify a falling wedge pattern by looking for downward price movement that creates lower lows and lower highs while staying mostly within two trend lines. During the formation of a falling wedge, a decrease in trading volume is typical. For optimal results, you should use the pattern in combination with other indicators – such as RSI to confirm lack of momentum in price continuation.
Cleo.finance provides a trendline trading tool that can help you enhance your trading strategies. It allows you to identify chart patterns and draw trendlines on the chart, and then you can incorporate into your automated trading system with ease. With over 55 technical indicators, you can effectively combine your identified chart patterns and improve your trading performance and profitability.