Chart Pattern Series (12/12): Bump and Run Reversal Bottom Pattern7 min read
When used in conjunction with technical indicators, chart patterns can provide valuable insights into the market, making them a crucial asset in trader’s toolkit. We have been writing extensively about chart patterns for quite some time, and this article now serves as the final installment in our chart pattern series. In this 12th article of the chart pattern series, we will be exploring the Bump and Run Reversal Bottom (BARR) pattern.
If you haven’t already, be sure to check out the previous series:
- Symmetrical Triangle Pattern
- Descending Triangle Pattern
- Ascending Triangle Pattern
- Pennant Chart Pattern
- Rising Wedge Chart Pattern
- Falling Wedge Pattern
- Bull Flag Pattern
- Bear Flag Pattern
- Bearish Rectangle Pattern
- Cup and Handle Pattern
Table of Contents
What is a Bump and Run Reversal Bottom (BARR) Pattern?
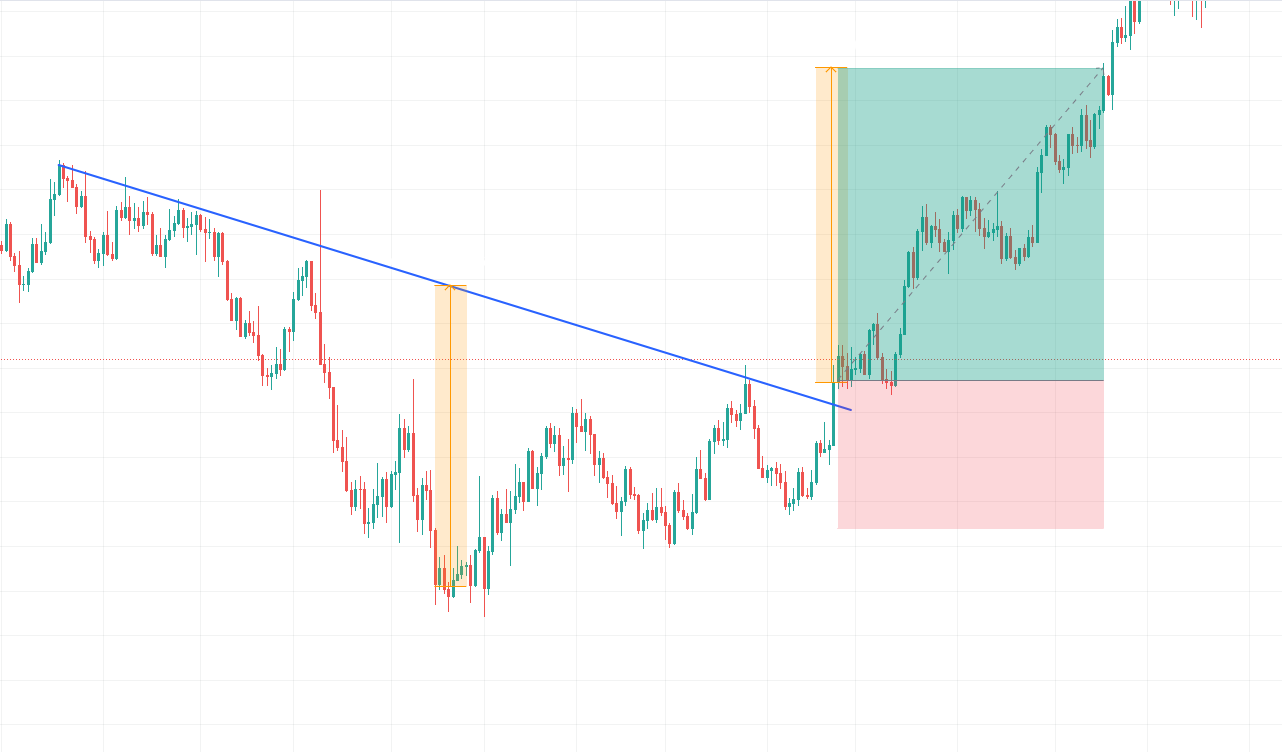
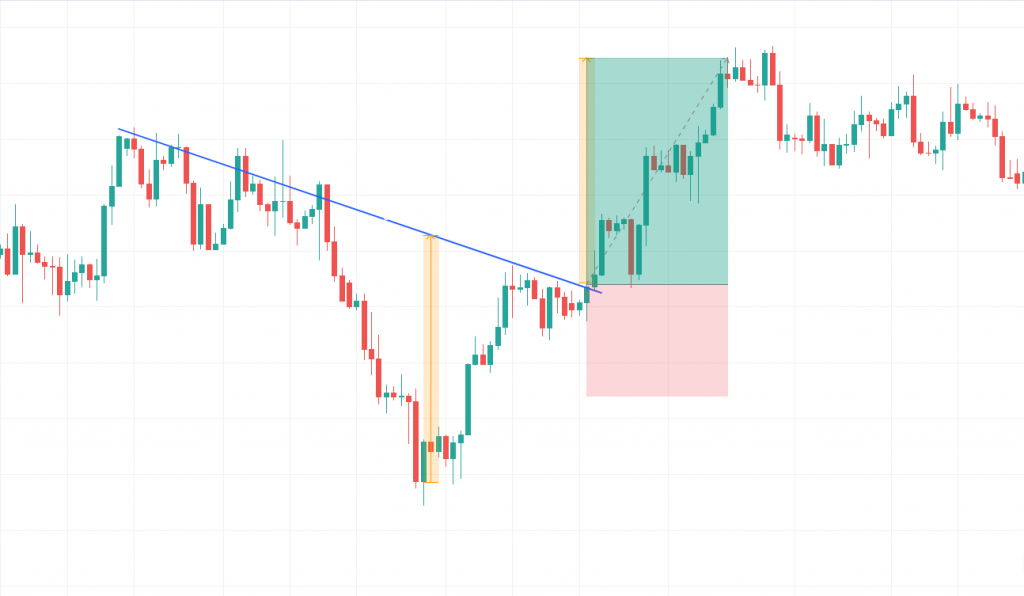
The Bump and Run Reversal Bottom (BARR) pattern is characterized by three distinct phases: the lead-in phase, the bump phase, and the run phase. The lead-in phase is a period of gradual price decline, followed by a sudden and sharp price increase during the bump phase. The run phase is a gradual price decline that follows the bump phase.
Many traders would see this pattern as a cup-with-handle, and it is indeed one. However, it’s also known as a Bump and Run Reversal (BARR) bottom, as a cup does not rely on a downward-sloping trend line. This pattern has a relatively low failure rate when it comes to breakouts and tends to show a significant rise after the breakout.
Is the Bump and Run Reversal Bottom (BARR) pattern a Continuation or Reversal Pattern?
Technically, the BARR pattern is a reversal pattern, meaning that it signals a potential trend reversal from a downward to an upward trend. Even though there are rare cases of continuations, reversal performs better than continuations.
Thomas Bulkowski has done one of the most comprehensive research on chart patterns. He analyzed daily data of US equities and identified more than 1099 trades based on the breakout Bump and Run Reversal Bottom pattern. The pattern ranked the best out of 39 chart patterns in terms of overall performance rank.
How to Identify a Bump and Run Reversal Bottom (BARR) Pattern?
To identify a Bump and Run Reversal Bottom (BARR) pattern, you need to identify its three phases: the lead-in phase, the bump phase, and the run phase. The lead-in phase involves a gradual price decline, while the bump phase is a sudden and sharp price increase. Finally, the run phase is a gradual price decline that follows the bump phase.
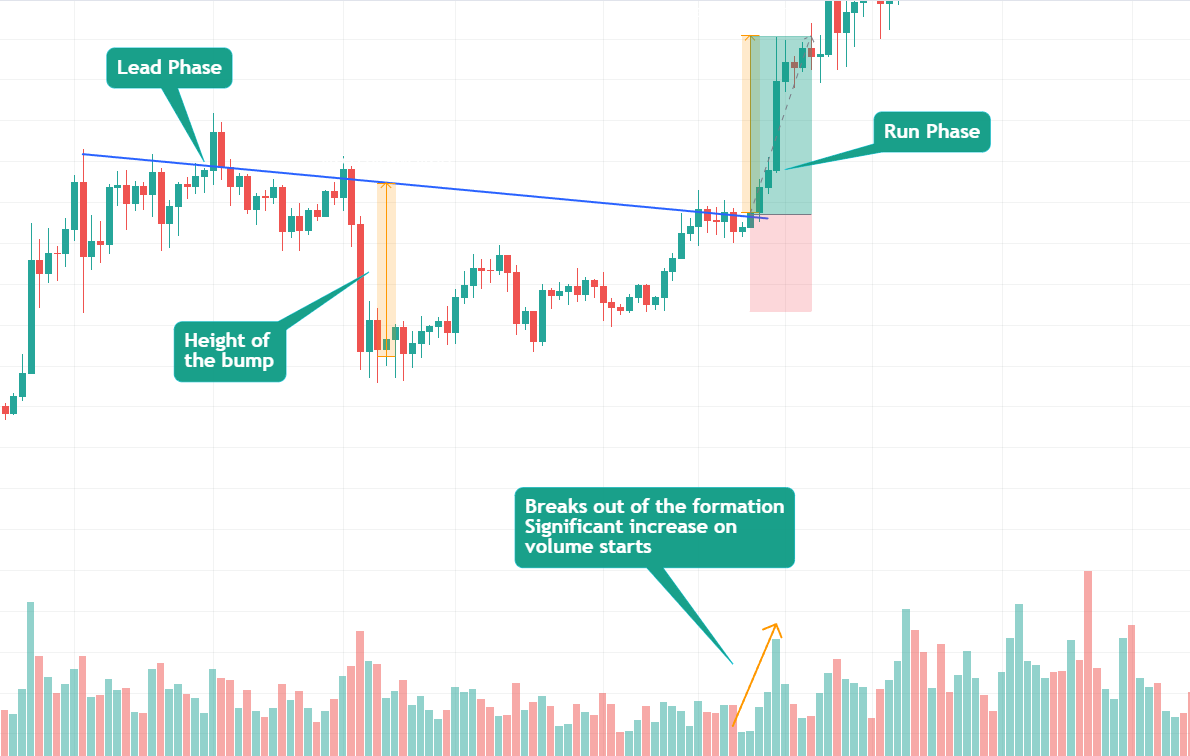
The trendline of the BARR pattern connects the lows of the lead-in phase and the bump phase. Once the price breaks through this trendline, it signals a potential trend reversal from a downward to an upward trend.
The volume trend during formation has no effect on the performance. But as prices break out of the formation and start moving higher, there is a significant increase in trading volume. Rising prices characterize the uphill run phase.
Where to Place Target and Stop Loss?
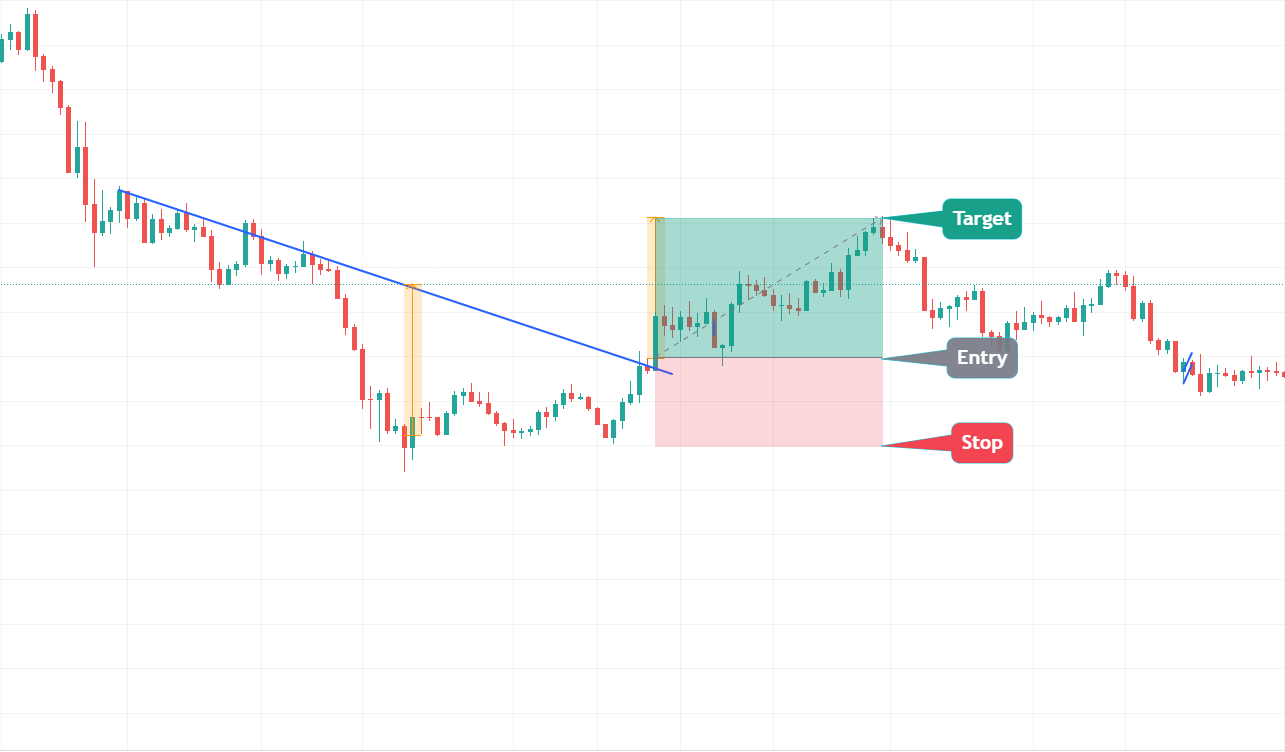
The target can be placed by measuring the height of the bump and adding it to the breakout point.
As a general practice, the stop loss is often placed at the midpoint of the bump phase. However, the most important consideration is to always aim for a risk-to-reward ratio of at least 2R. (for every 1 unit of risk). You can use this rule as a guideline when determining the placement of your stop loss.
According to Thomas Bulkowski’s research, the pullback/throwback rate for the Bump and Reversal Bottom (BARR) pattern can be considered to be high. About 6/10 times, the price will retrace back to either the breakout point or the apex point of the pattern.
How to Trade a Bump and Run Reversal Bottom (BARR) Pattern Automatically or as a crypto bot?
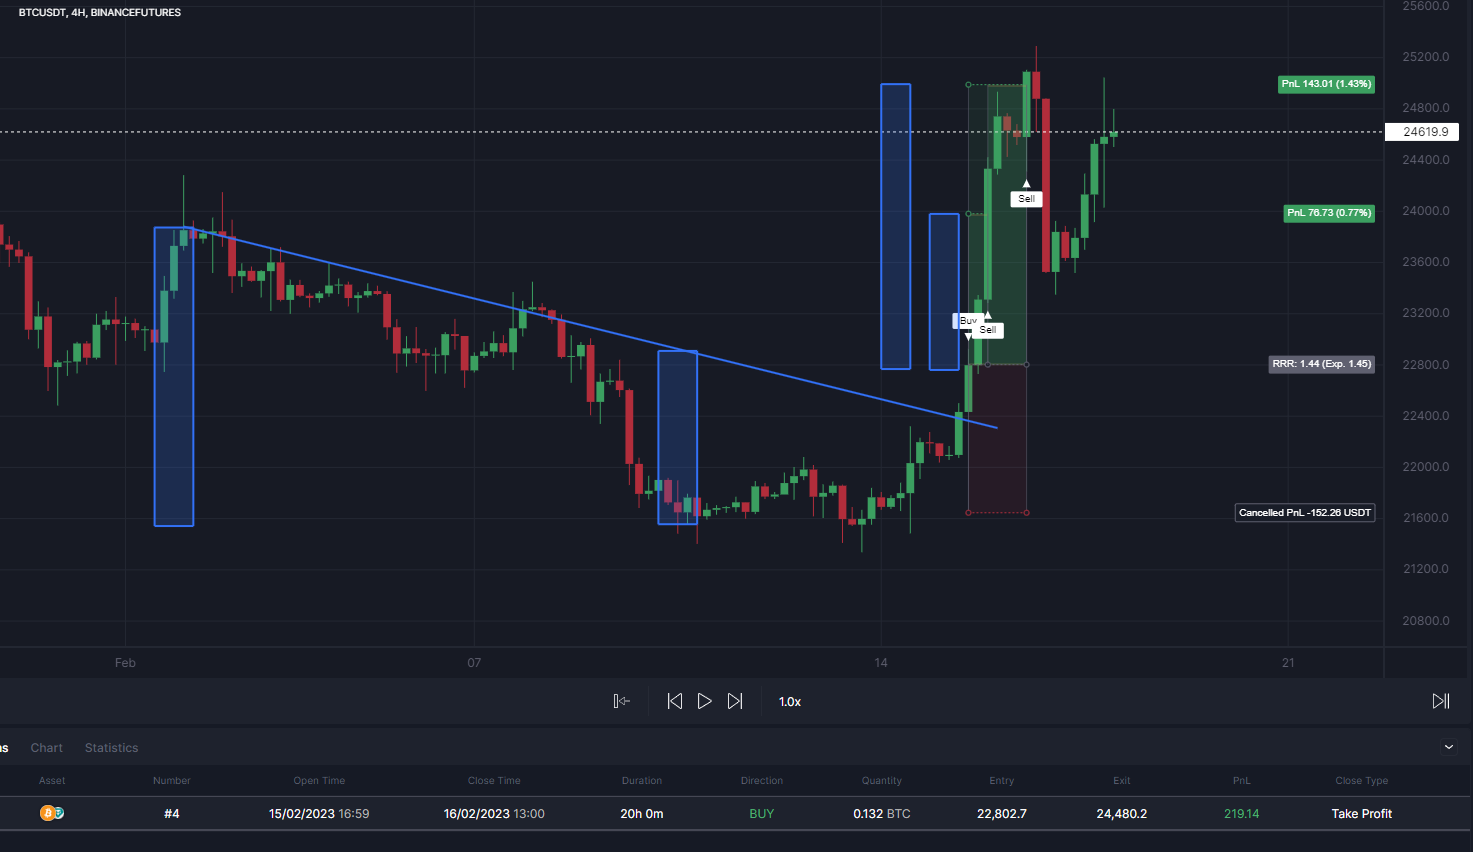
On cleo.finance, traders can use trendline trading tools to easily identify and draw the Bump and Run Reversal Bottom (BARR) pattern. Once identified, traders can automate their trading strategy by selecting entry and exit conditions based on the chart pattern. For instance, traders can enter the trade when the price breaks through the trendline with a stop-loss order placed midpoint of the bump phase.
Step-by-Step Guide:
- Identify the BARR pattern on cleo.finance trading chart – the lead-in phase, bump phase, and run phase. Draw the trendline that connects the lows of the lead-in and bump phases, known as the neckline.
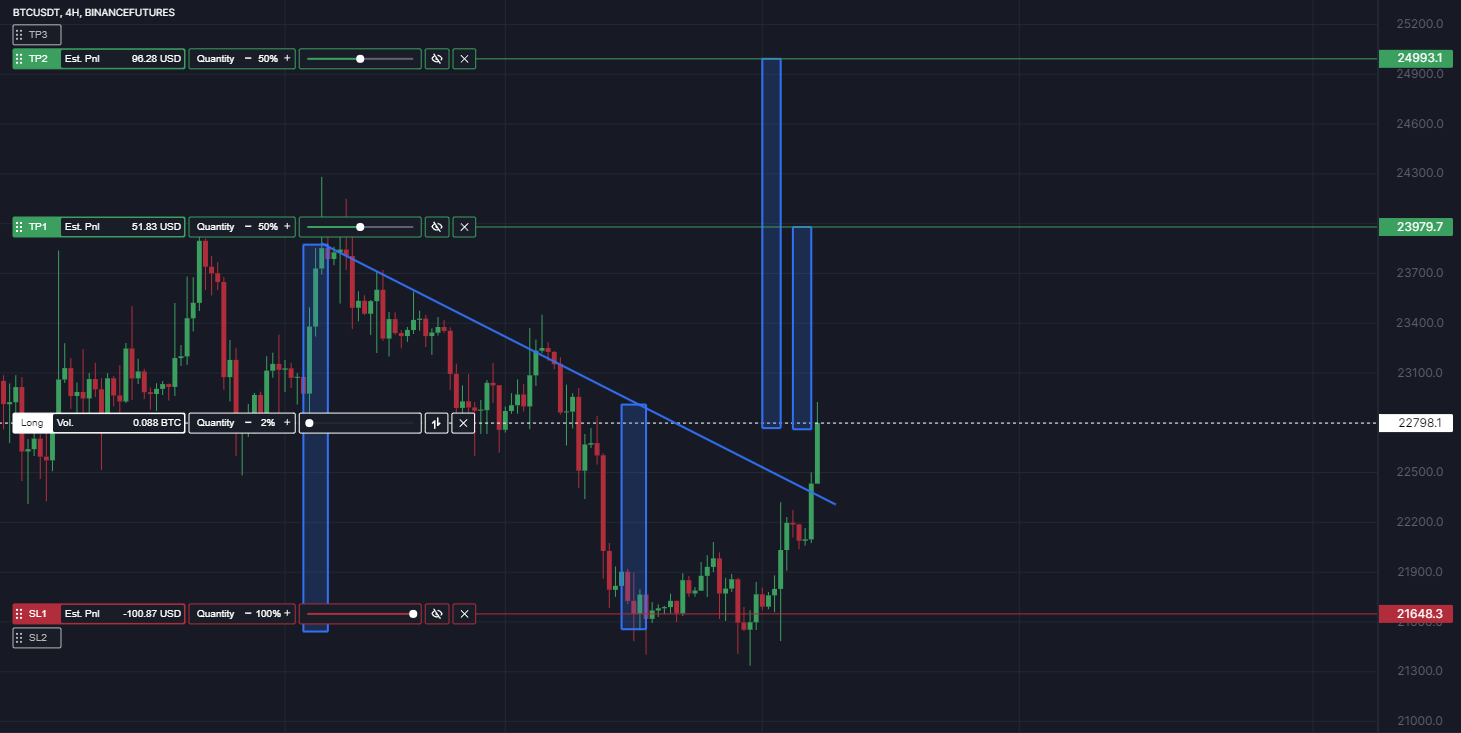
2. Once you draw your chart patterns via trendlines, the trendlines will have an auto-generated name that you’ll need to use in the entry or exit conditions. So you can simply start writing your conditions “Price” and then pick the comparison you want. Your drawn trendlines will be available in the drawing> Trendline section.
3. Set your volume and then you can place your stop midpoint of the bump phase. Set your target by measuring the height from the bottom of the bump and then placing it above the breakout point. You can also place a 2nd target measuring from the start of the lead phase to the bottom of the bump phase and place it above the breakpoint. With cleo.finance, you can place up to 4 Take Profit and 4 Stop Losses!
4. All set and now you can hit the deploy live button.
Conclusion
The Bump and Run Reversal Bottom (BARR) pattern is a technical chart pattern that signals a potential trend reversal from a downward to an upward trend. The pattern consists of three phases: the lead-in phase, the bump phase, and the run phase. Volume trend during formation has no effect, but when prices break out and rise, trading volume significantly increases. BARR pattern is the best performer out of 39 chart patterns that Thomas Bulkowski tested based on 1099 perfect trades. Traders can achieve better results by using the pattern in conjunction with other technical indicators.
Cleo.finance offers a user-friendly trendline trading tool that allows you to enhance your trading strategies effortlessly. With the trendline tool, you can draw trendlines and recognize chart patterns directly on the chart, seamlessly integrating them into your automated trading system. Moreover, you have the flexibility to combine over 55 technical indicators with your chart patterns, enabling you to derive precise outcomes and make well-informed trading choices.
Do you need to backtest your strategy on the chart or practice it beforehand? Not an issue! Just visit Cleo.finance’s latest addition to its innovative arsenal of tools, the Manual Backtester! With this tool, you can use custom drawing tools directly on historical data displayed on the trading chart. You can also simulate and place positions as if they were happening in real-time.