Chart Pattern Series (8/12): Bear Flag Pattern7 min read
Having chart patterns as a part of your trading arsenal can enhance your trading decisions with more confidence and profitability. In this 8th article of the chart pattern series, we will be exploring the Bear Flag Pattern.
If you haven’t already, be sure to check out the previous series:
- Symmetrical Triangle Pattern
- Descending Triangle Pattern
- Ascending Triangle Pattern
- Pennant Chart Pattern
- Rising Wedge Chart Pattern
- Falling Wedge Pattern
- Bull Flag Pattern
Table of Contents
What is the Bear Flag Pattern?
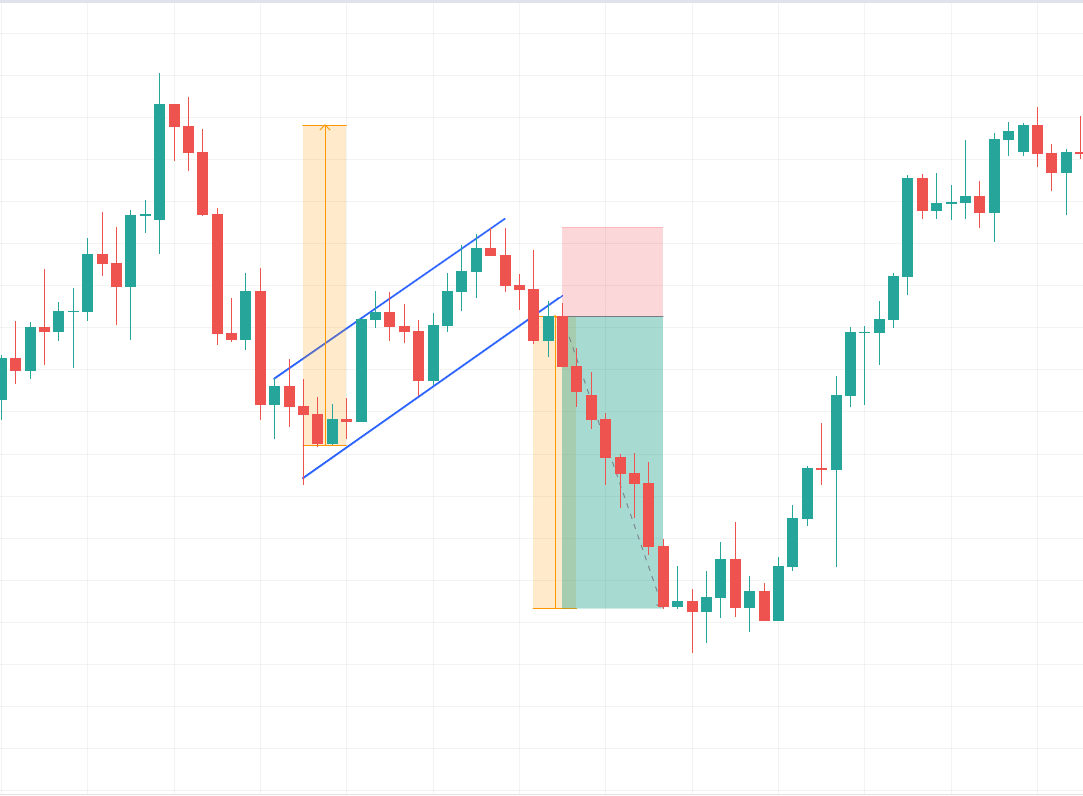
The bear flag pattern forms when two sharp price drops are separated by a short period of consolidating retracement. The price drops sharply, catching bulls off-guard as sellers take over. The initial sharp price drop is called the flagpole.
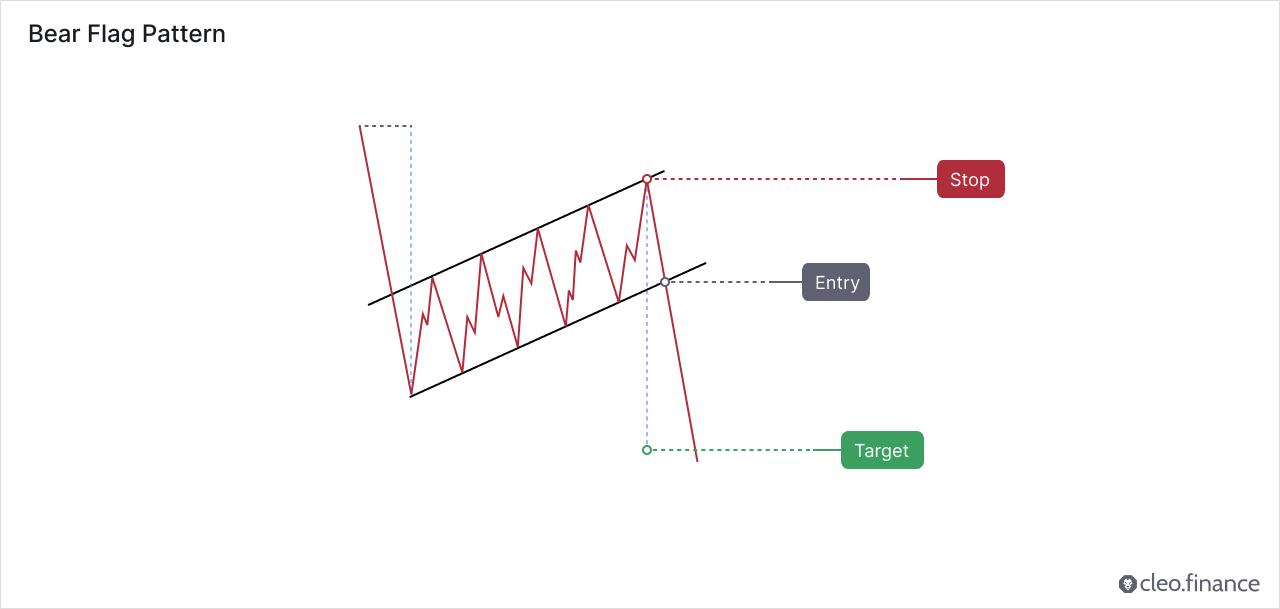
In a downtrend, a bear flag will form a short consolidation higher after the sharp price drop. This suggests that a more bearish move is forming and the price is likely to continue downwards after the slow consolidation higher. The breakout occurs when the lower support trendline is broken. This often leads to another downtrend move with prices falling toward the low of the formation.
Is the Bear Flag Pattern a Continuation or Reversal Pattern?
Bear flag occurs often in the market and it is generally considered to be a continuation pattern. It signals a pause or consolidation within a downtrend, where the bears take a brief break, and prices move slightly upward in a rectangular shape before continuing the downtrend. The breakout often occurs with a significant trading volume. Traders should look for either a break of important support or a pullback.
How to Identify a Good Bear Flag Pattern?
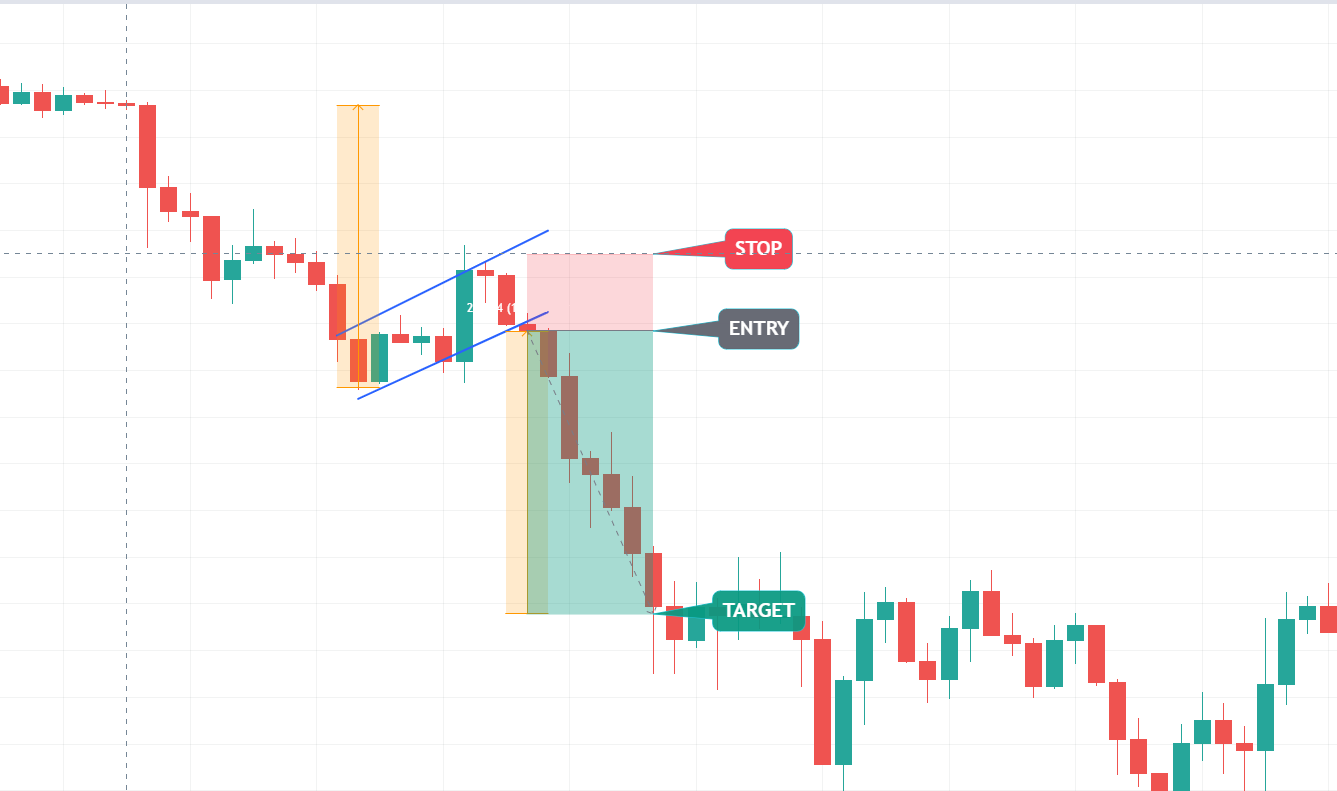
Traders can follow some guidelines to further validate a good bear flag pattern. The bear flag pattern is a chart pattern that occurs during a downtrend. Traders should look for a fast and sharp decline in price (called a flagpole). This is followed by a brief period of consolidation (known as a flag), which is surrounded by two parallel upward-trending lines.
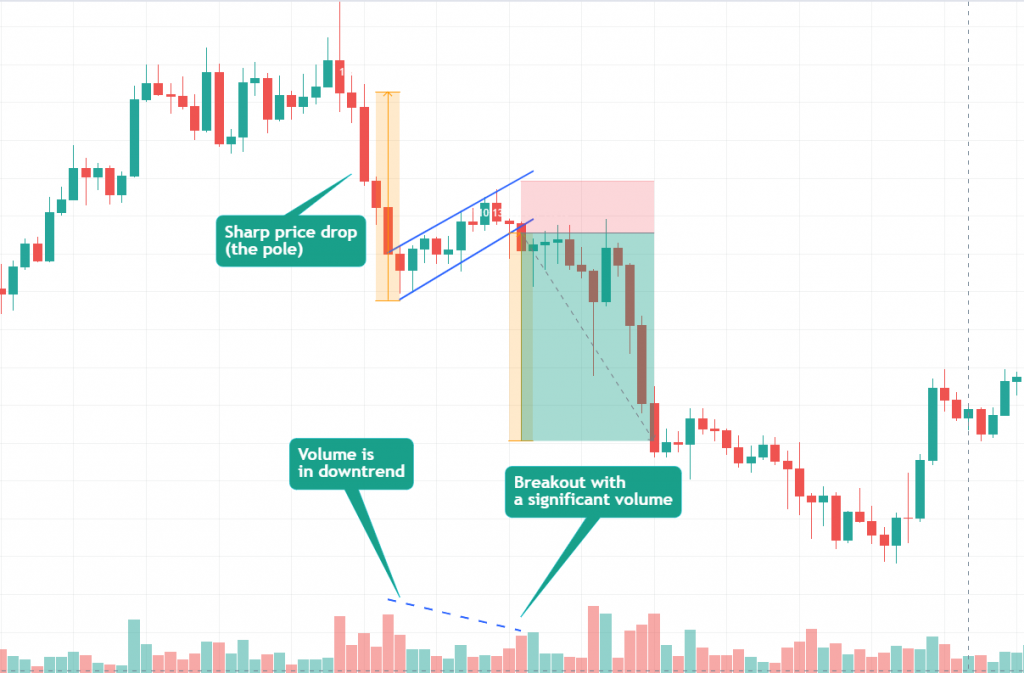
In bear flag formation, the volume is often in a downward trend. The breakout from the flag pattern typically occurs with a significant volume and confirms the continuation of the downtrend. Although this is not always the case, flag patterns with a diminishing volume or light breakout volume usually perform better.
During the consolidation phase, traders watch out for the price breakdown through the lower trendline and make a new low since it shows the bears are in control again to push another decline. According to Bulkowski’s research, pullbacks can have a negative impact on the performance of bear flag patterns.
Where to Place Target and Stop Loss?
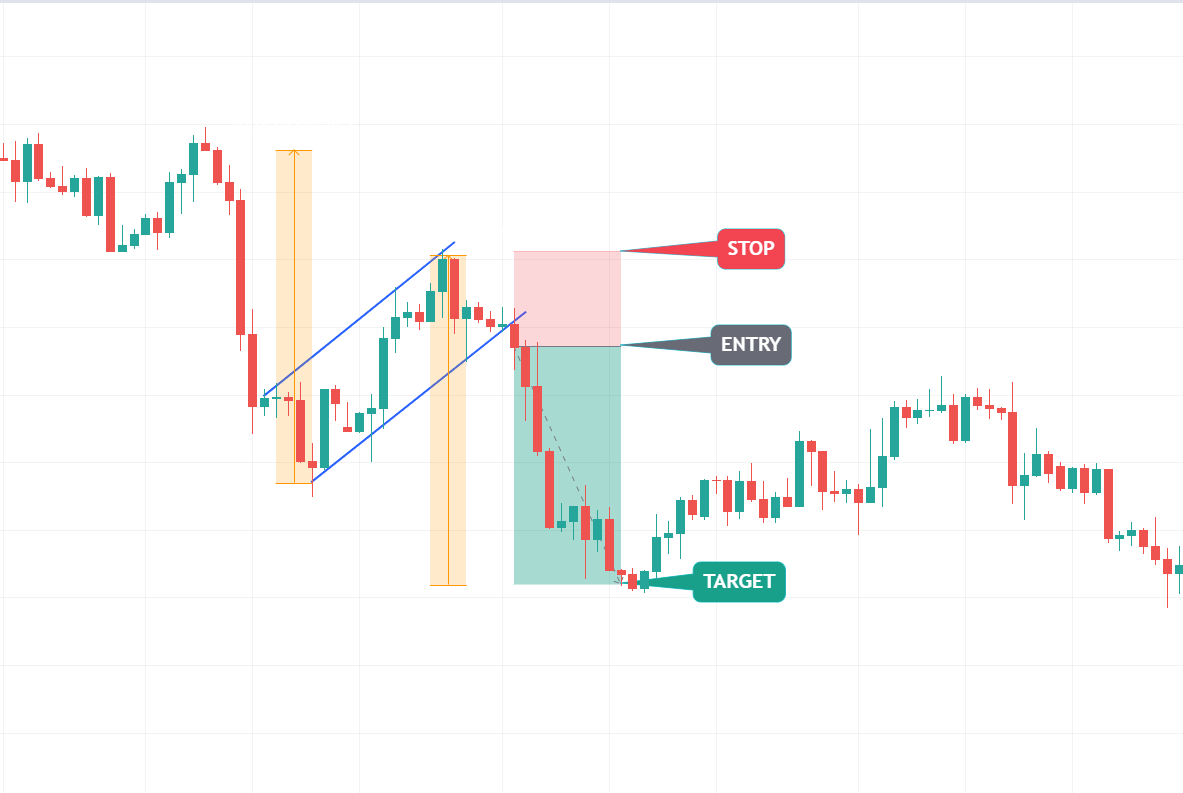
The target can be placed by measuring the distance from the start of the sharp price movement (the pole of the bear flag) to the point where the pattern’s upper trend line ends.
The stop loss can be placed above the upper trend line of the pattern. And you should aim for a risk-to-reward ratio of at least 2R. (for every 1 unit of risk you expect 2 units of reward).
How to Trade a Bear Flag Pattern Automatically or as a Crypto Bot?
Cleo.finance’s trendline trading tool allows you to efficiently identify and draw bear flag patterns and automate them by integrating them into your trading strategy as your entry and exit criteria. By leveraging Cleo.finance’s trendline trading tool, you can take advantage of potential breakout opportunities while reducing risk by exiting the trade in the opposite direction of the breakout. The trendline trading tool is built to provide traders with a more systematic and effective trading approach, helping them stay focused on achieving their trading objectives.
Step-by-step Guide
1. Identify your bull flag pattern on cleo.finance trading chart – the two sharp price drops are separated by a short period of consolidating retracement period.
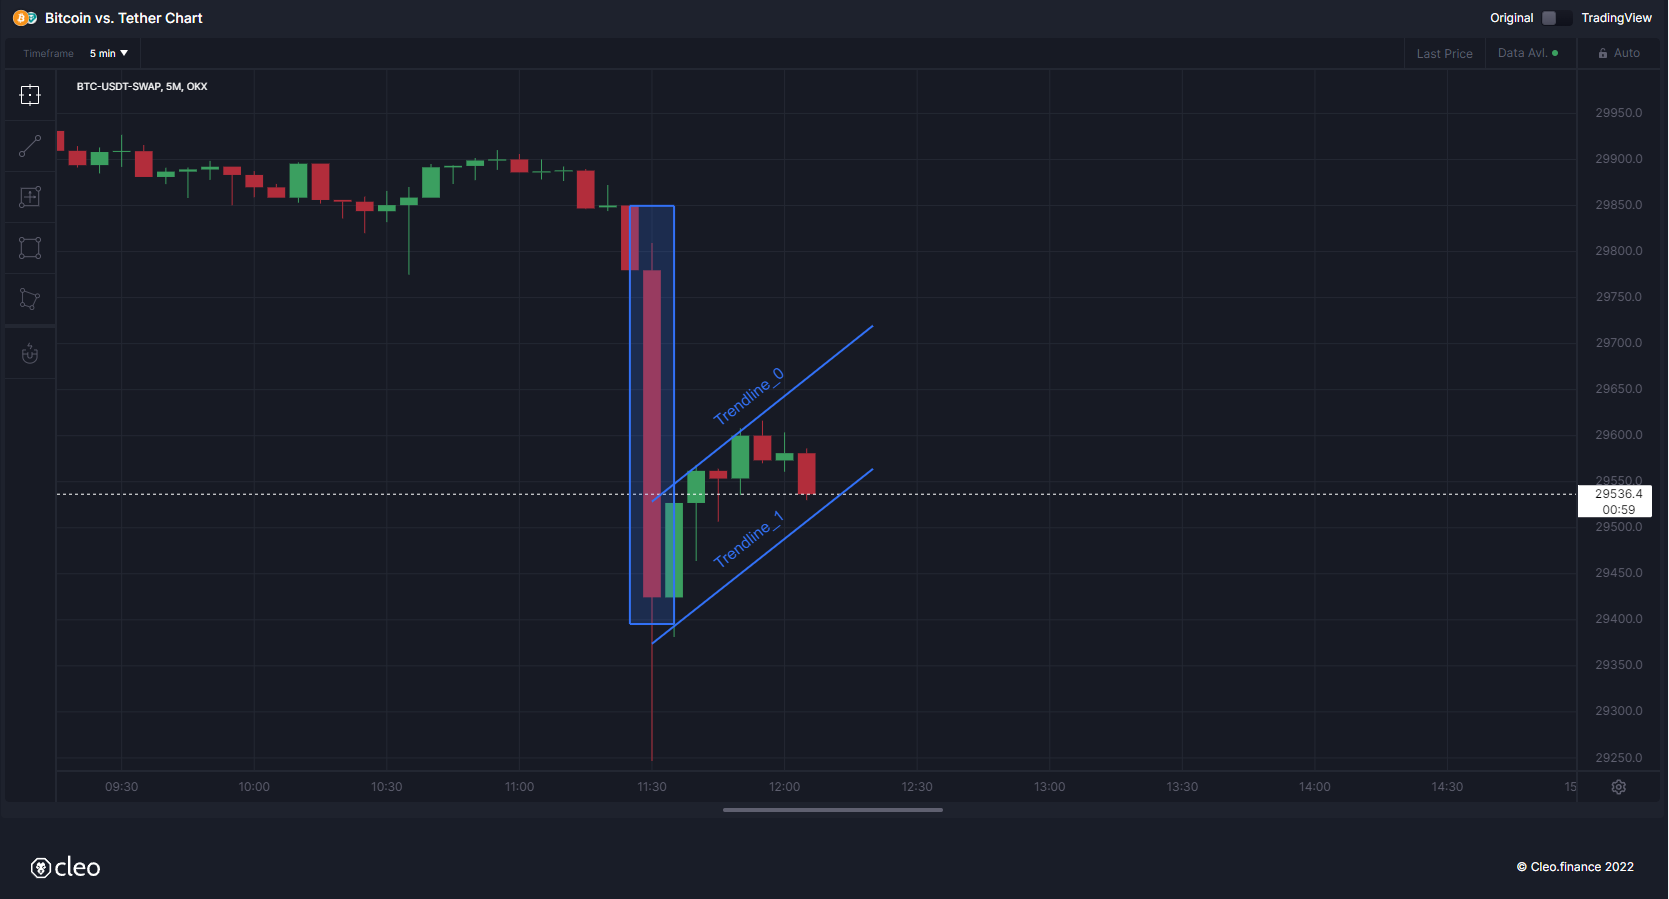
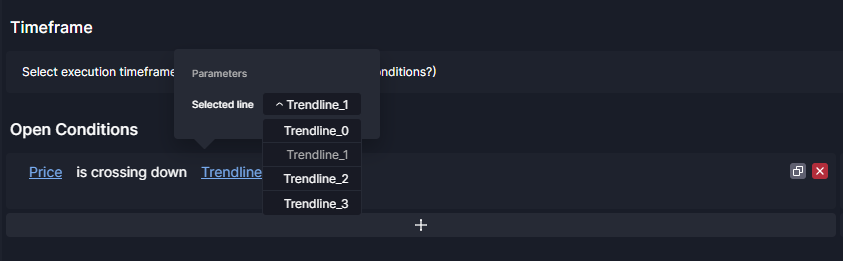
2. Once you draw your chart patterns via trendlines, the trendlines will have an auto-generated name that you’ll need to use in the entry or exit conditions. So you can simply start writing your conditions “Price” and then pick the comparison you want. Your drawn trendlines will be available in the drawing> Trendline section.
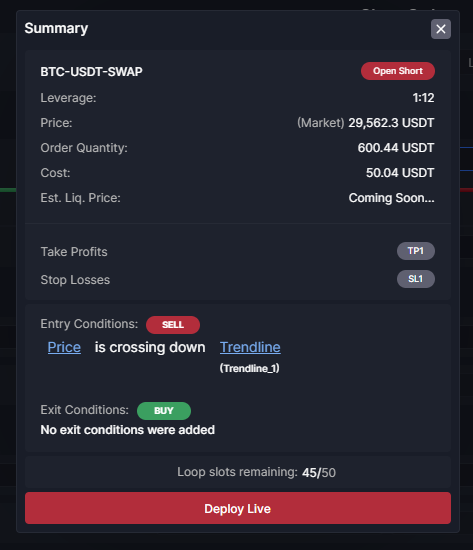
3. Set your volume and then you can place your stop above the upper trend line of the pattern with around 1:2 RR (Risk to reward ratio). Set your target at the same height as the pole of the bear flag to the point where the pattern’s upper trend line ends.
4. All set and now you can hit the deploy live button.
Conclusion
The bear flag typically occurs in a downtrend market and is characterized by a steep drop in prices forming the flagpole, followed by a period of consolidation creating a flag shape. During the brief consolidation phase, the trading volume is often low, although this may not always be the case.
Flag patterns with a downtrend volume or light breakout volume usually perform better. Traders should carefully monitor the price action during this time, searching for signs of a break below the lower trendline and a new low, indicating that the bears are in control and could push the price lower. It is important to keep in mind that using other technical indicators in conjunction with the bear flag pattern can provide traders achieving better outcomes.
Cleo.finance’s trendline trading tool provides you with the ability to refine your trading strategies effortlessly. You can spot chart patterns and draw trendlines directly on the chart and integrate them into your automated trading system. Additionally, you can incorporate your identified chart patterns with more than 55 technical indicators to obtain optimal results that can help you make more informed trading decisions.