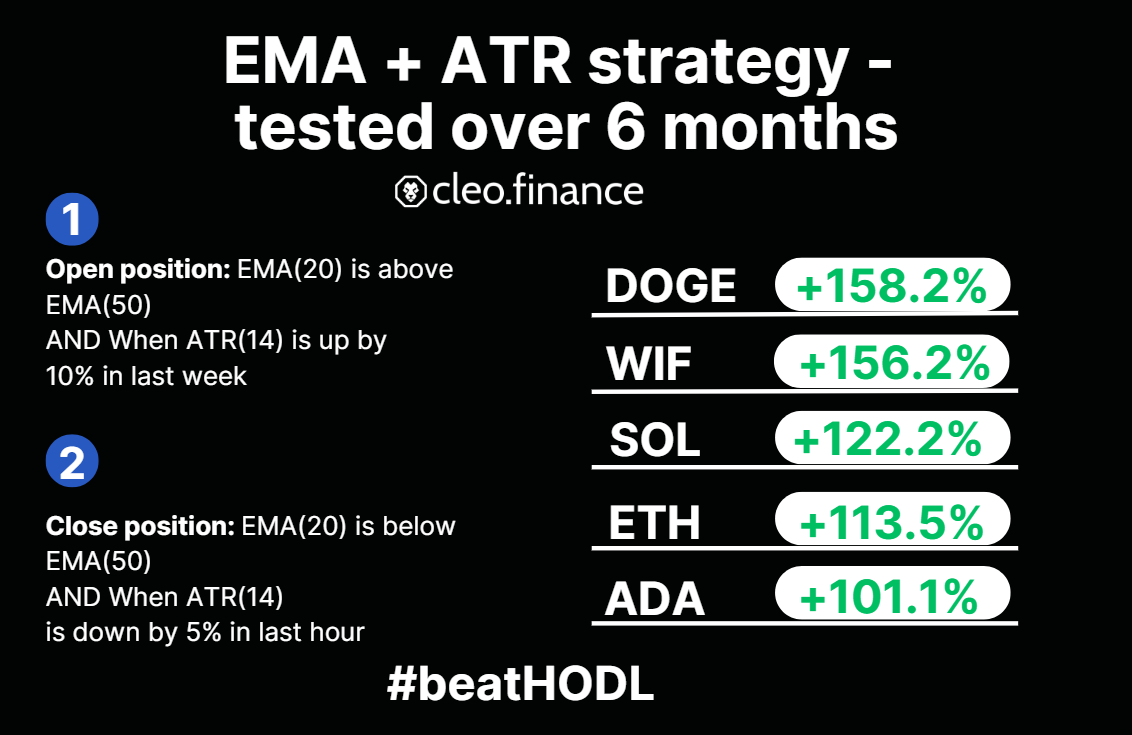
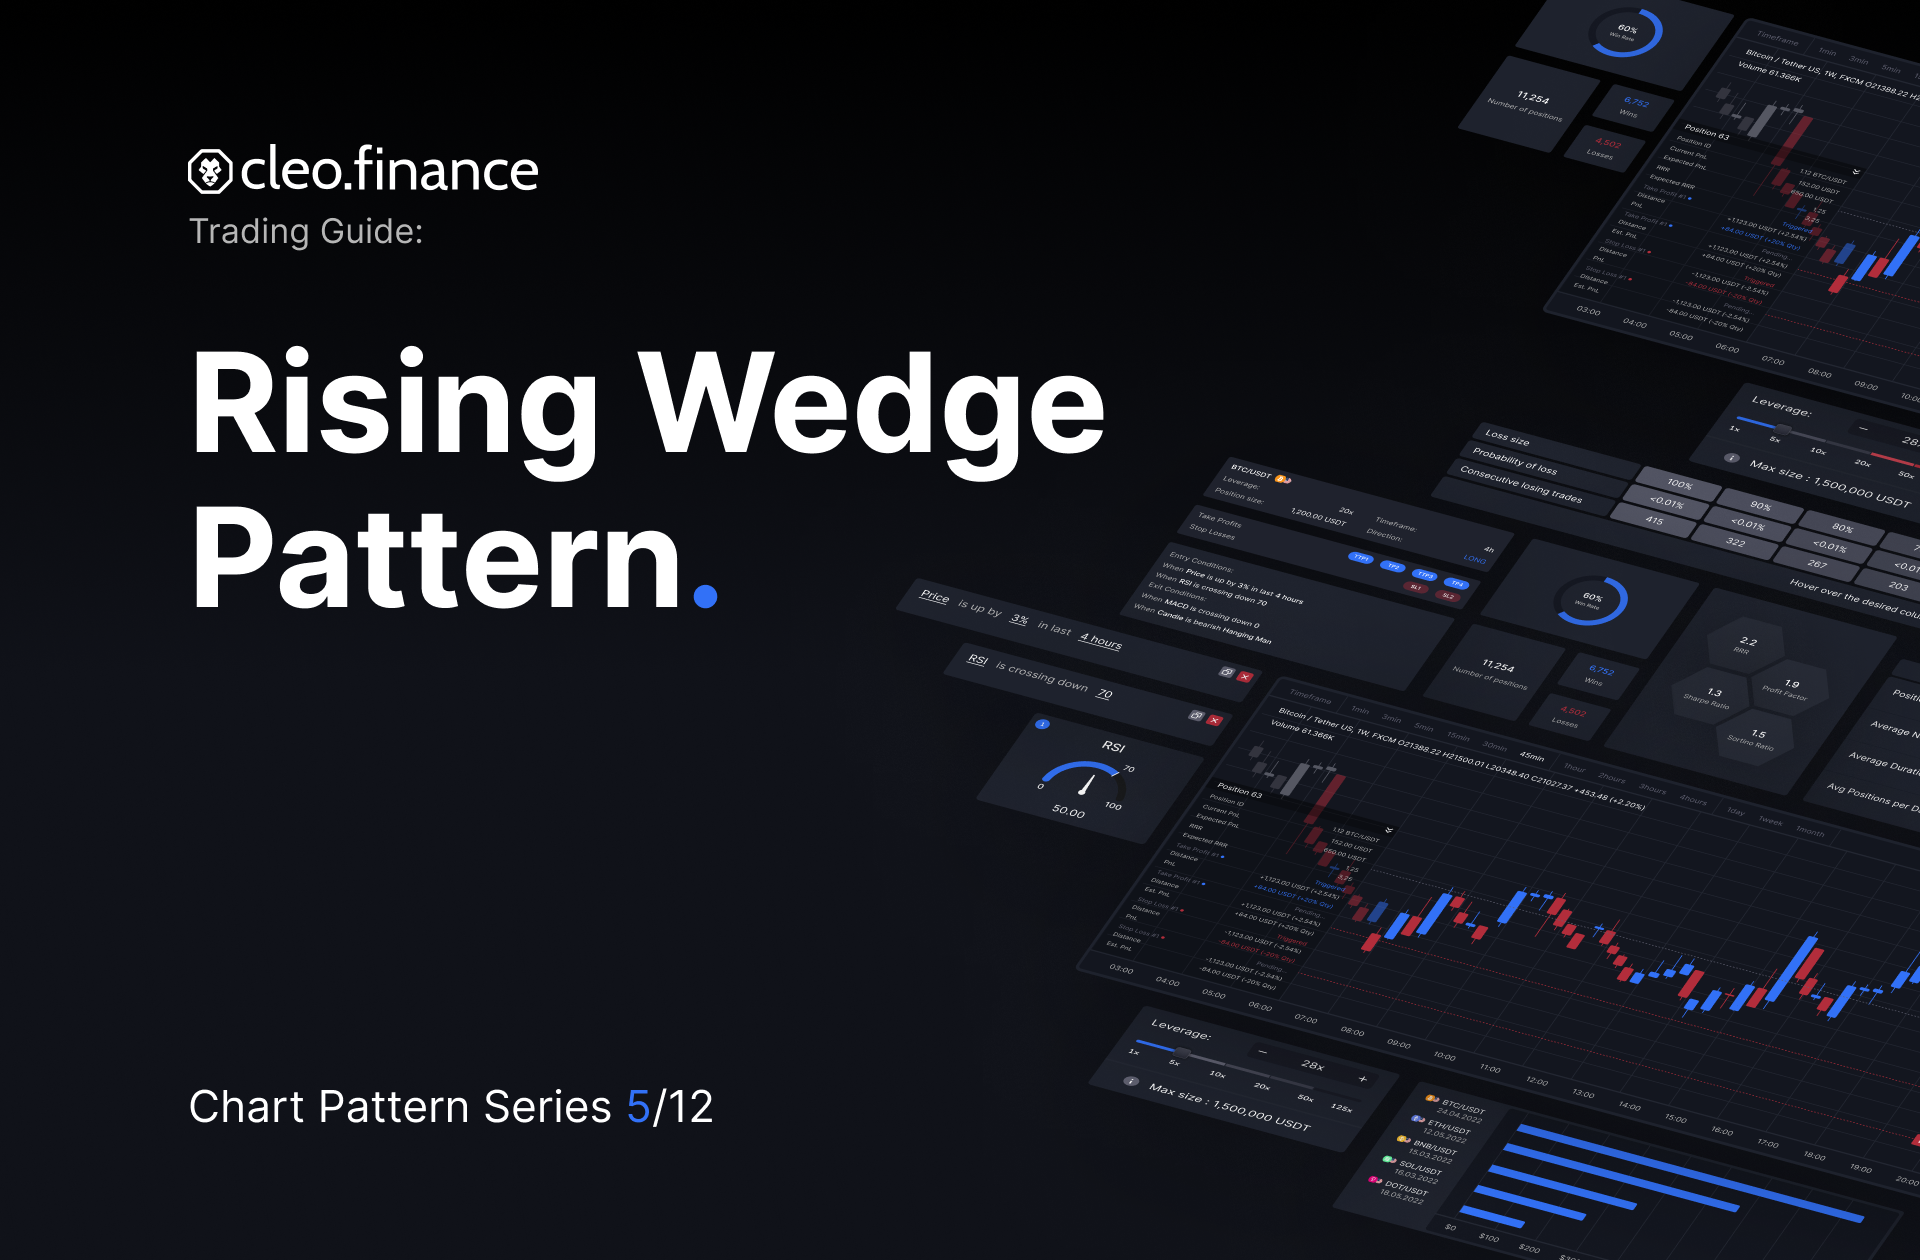
Chart Pattern Series (5/12): Rising Wedge Pattern9 min read
Studying chart patterns helps traders gain a deeper understanding of market behavior and predict future price movements with better accuracy. Whether you are a seasoned trader or just starting out, chart patterns can be an essential tool for improving your trading strategies and maximizing your profits. In this fifth article of the chart pattern series, we will be exploring the Rising Wedge Pattern. So, grab your coffee and let’s get to it.
If you haven’t already, be sure to check out the previous articles in the series:
- Symmetrical Triangle Pattern
- Descending Triangle Pattern
- Ascending Triangle Pattern
- Pennant Chart Pattern
- Falling Wedge Pattern
- Bull Flag Pattern
- Bear Flag Pattern
Table of Contents
What is Rising Wedge Pattern?
A wedge pattern is a triangle pattern with both trendlines heading in the same direction. A rising wedge has both lines heading upward, with the lower bound rising more quickly than the upper bound.
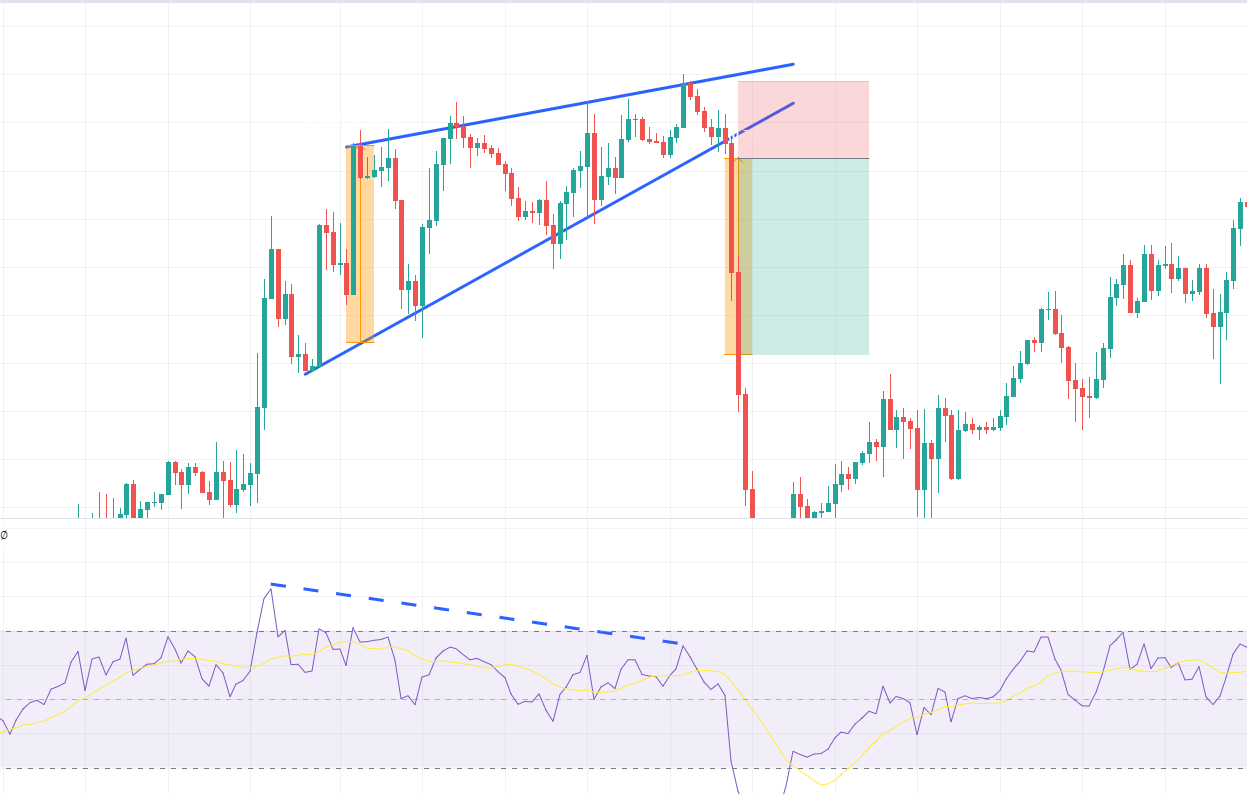
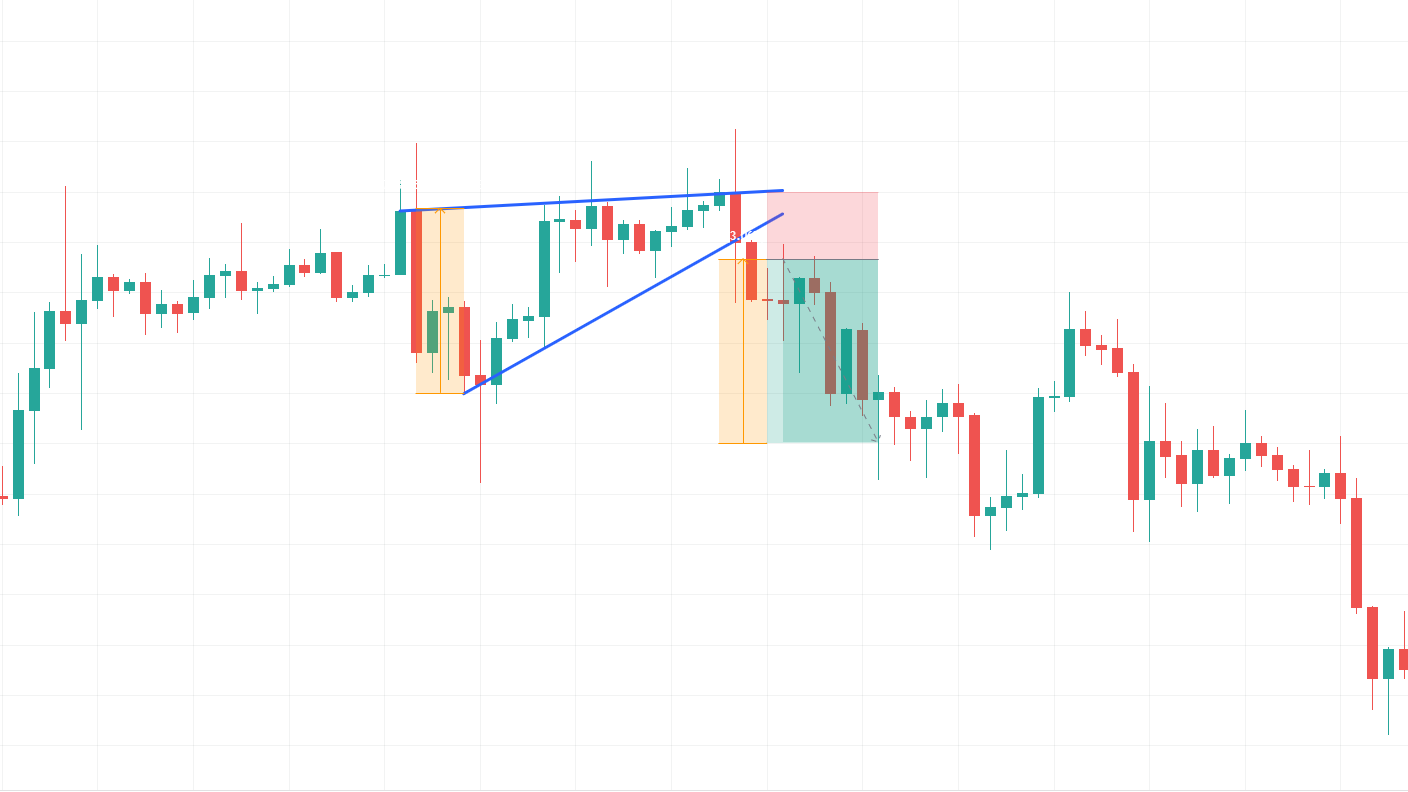
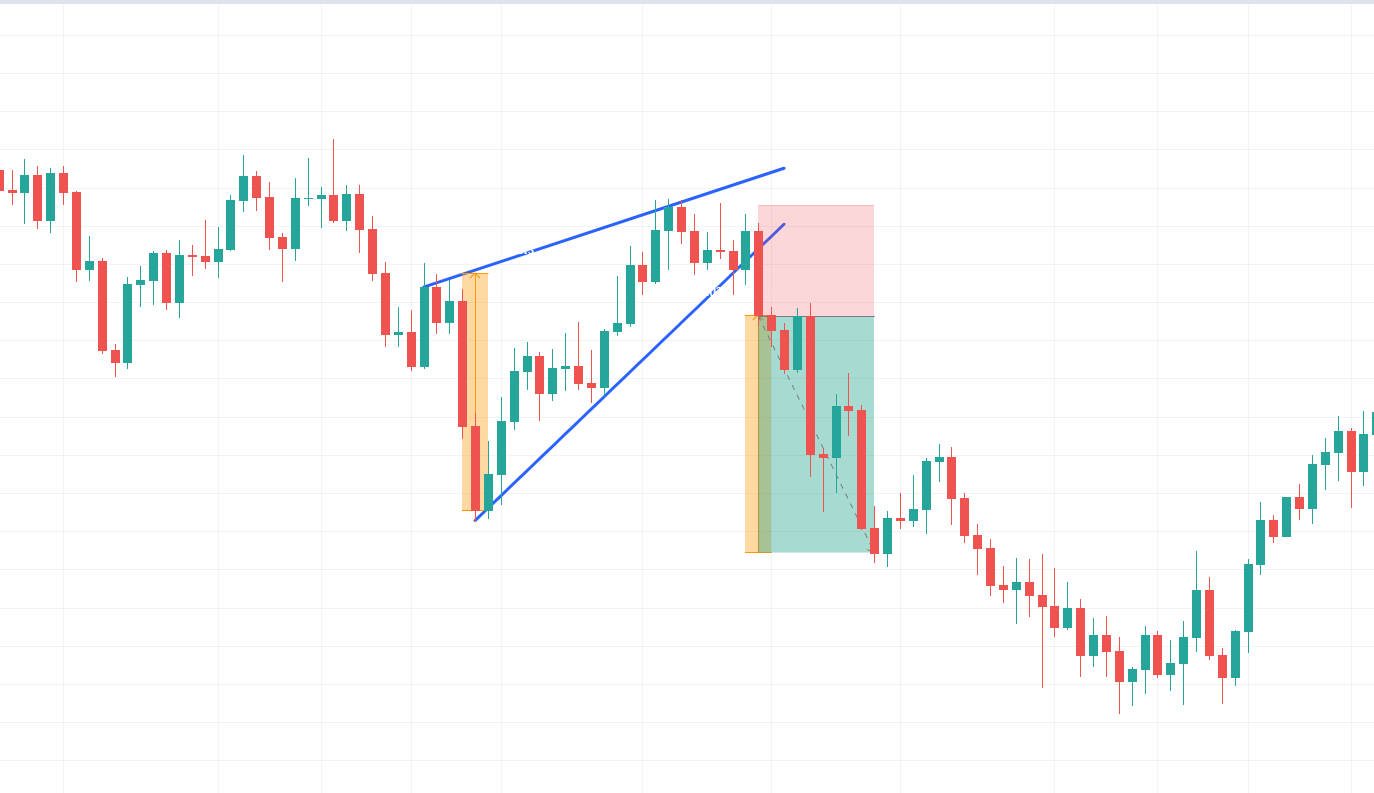
Rising wedge patterns often occur during periods of consolidation in an uptrend and are identified by a series of upward moves that converge to form a wedge shape, creating a series of rising price actions. When the price approaches the apex of the rising wedge, the trading range mostly narrows, and often there is a sharp downward breakout that signals a reversal in the previous uptrend.
Rising Wedge patterns are more common during consolidation periods, but they can provide more significant signal after a peak has already been established. The price usually stays within the trendlines (with no intraday or fake breakouts) until the final breakout occurs. Rising Wedge patterns can play different roles, serving as consolidation patterns against or with the prevailing trend or as topping patterns, particularly when accompanying a liquidity run peak.
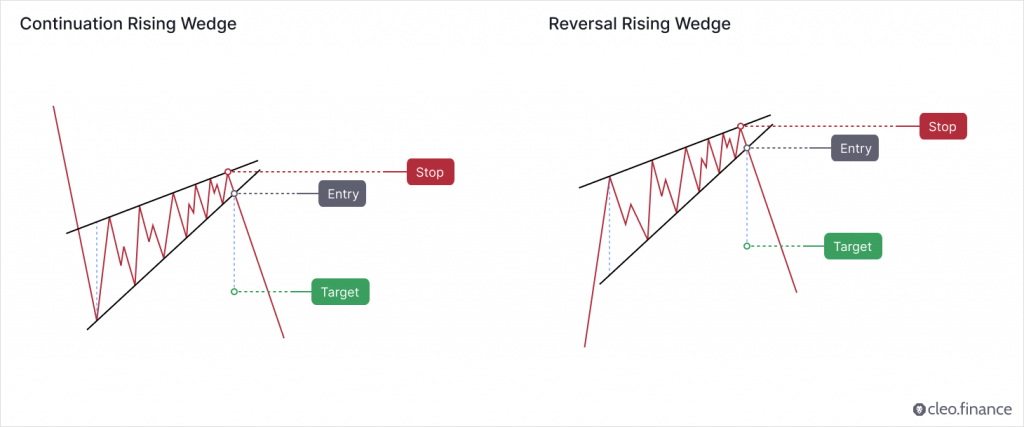
Is the Rising Wedge Pattern a Continuation or Reversal Pattern?
The rising wedge is commonly considered a bearish reversal pattern. At first, the pattern may appear to be a bullish move. However, it’s important to note that each subsequent peak and trough is getting shorter than the last, indicating that bearish momentum is building.
On the other hand, there are cases where the rising wedge pattern can act as a continuation pattern. If the pattern forms in an uptrend and the price breaks above the upper trendline, it may indicate that the bulls are still in control and the price is likely to continue higher. However, this is less common than the bearish reversal scenario.
Thomas Bulkowski is known for conducting one of the most comprehensive publicly available studies on chart patterns. He analyzed daily data on US equities and identified over 1,400 trades based on the breakout of the rising wedge pattern. According to his findings, the rising wedge tends to perform better in upward breakouts, compared to downward breakouts. The pattern ranked 32nd out of 39 chart patterns for upward breakouts and ranked last out of 36 chart patterns for downward breakouts.
How to Identify a Good Rising Wedge Pattern?
The rising wedge pattern is among the difficult patterns to identify. But fear not, there are some guidelines that can make identification simpler. In a rising wedge pattern, price moves upward, forming higher highs and higher lows, but it stays within two trend lines most of the time. It is not very common for the price to move beyond these trend lines until the potential breakout occurs.
Rising wedges form either during a long downward price trend or after an upward peak. It may look like small rallies that go against the overall trend but are weak. These rallies usually don’t last long, and the prices continue to fall.
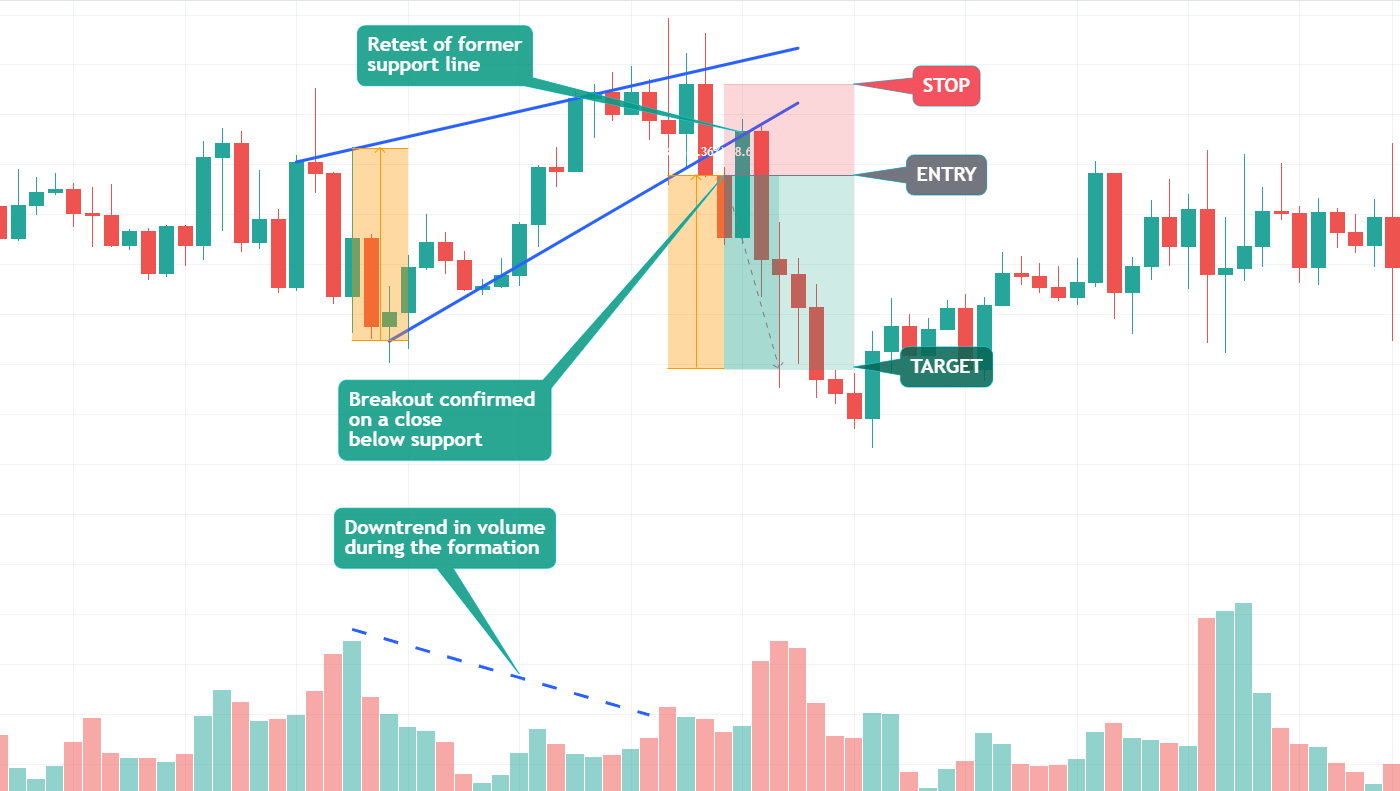
In both consolidation and reversal scenarios, diminishing volume during the rising wedge formation is common. When a rising wedge pattern reaches a peak, the chances are high that the break out will be downward. This is because the emotions and commitments have been exhausted during the peak and that leaves little room for a comeback during the test phase. A downward breakout from a rising wedge pattern often indicates a long-term downward reversal.
The trendlines tend to move in the same direction when a rising wedge is not present. According to Bulkowski, to be classified as a wedge, the pattern needs to touch at least five reversal points in total – three on one trendline and a minimum of two on the other trendline.
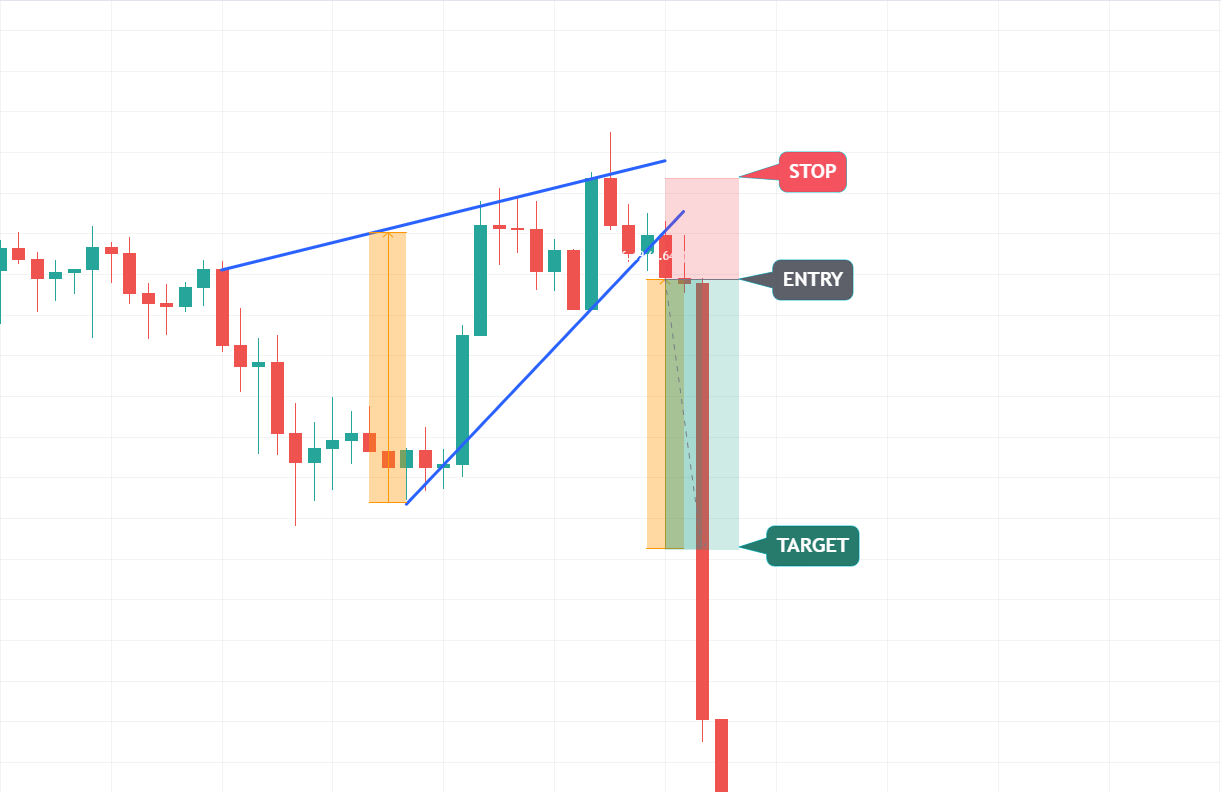
Where to Place Target and Stop Loss?
The target for a rising wedge pattern can be placed by measuring the height of the wedge at its widest point and extending that distance up from the trend line breakout.
Stops are commonly placed above the top side of the rising wedge. And you should aim for a risk-to-reward ratio of at least 2R. (for every 1 unit of risk)
According to Thomas Bulkowski’s research, the pullback/throwback rate for a rising wedge pattern is typically high. About 7/10 times, the price will retrace back to either the breakout point or the apex point of the pattern. This means that there is a significant chance that the price will retest the wedge’s resistance line before continuing the movement, which can negatively impact the pattern’s performance. Traders should keep this in mind when considering entry and exit points.
How to Trade a Rising Wedge Pattern Automatically or as a crypto bot?
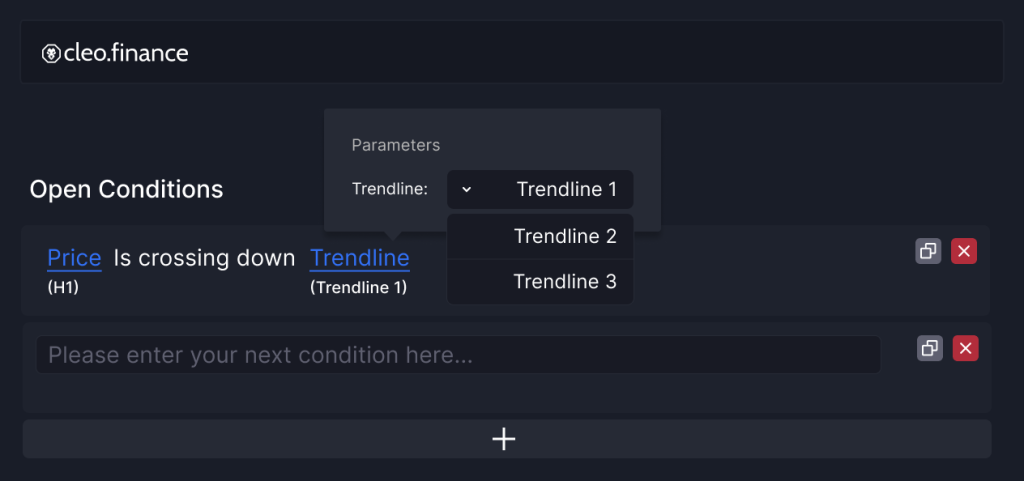
With the help of the trendline trading tool on Cleo.finance, you can identify and draw rising wedge patterns with ease. Once you’ve identified the pattern, you can leverage the power of automation to execute your trading strategy by setting trendlines as your entry and exit conditions. This way, you can utilize on potential breakout opportunities when the price moves beyond the trendline while reducing your downside risk by exiting the trade in the opposite direction of the breakout. With a systematic and efficient trading approach, you can stay focused on your trading goals.
Step-by-step Guide
1. Identify your rising wedge pattern on cleo.finance trading chart – both lines heading upward, price moves upward, forming higher highs and higher lows.
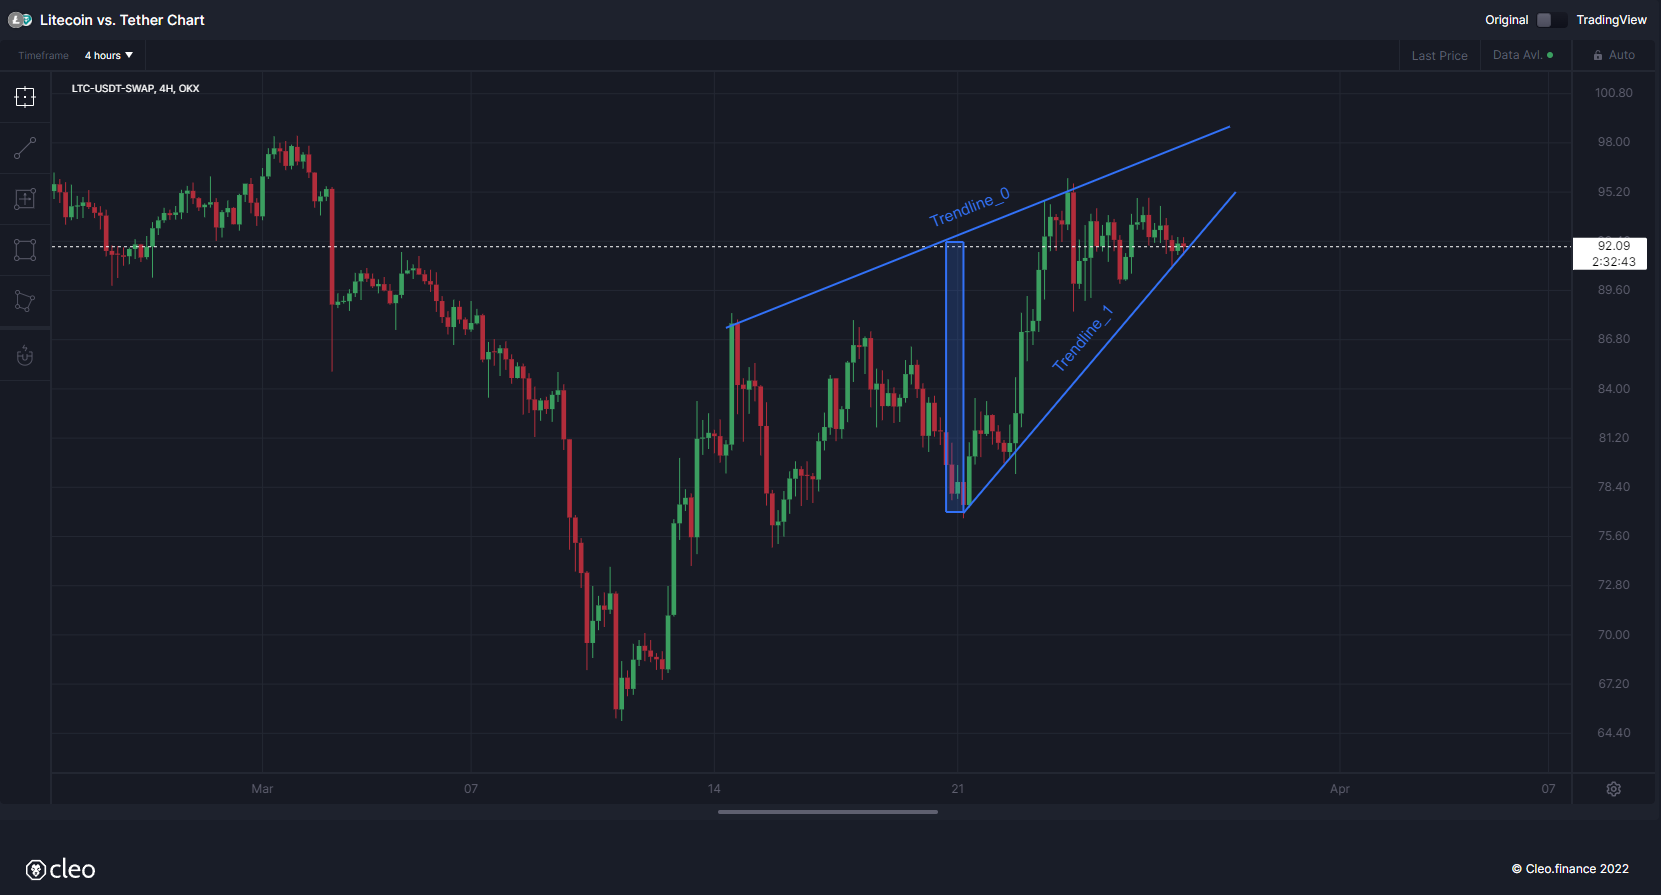
2. Once you draw your chart patterns via trendlines, the trendlines will have an auto-generated name that you’ll need to use in the entry or exit conditions. So you can simply start writing your conditions “Price” and then pick the comparison you want. Your drawn trendlines will be available in the drawing> Trendline section.
3. Set your volume and then you can place your stop above the top side of the rising wedge with around 1:2 RR (Risk to reward ratio). Set your target at the same height as the widest point of rising wedge.
4. All set and now you can hit the deploy live button.

Conclusion
Traders can identify a rising wedge pattern by looking for upward price movement that creates higher highs and higher lows while staying mostly within two trend lines. During the formation of a rising wedge, a decrease in trading volume is typical. When the pattern reaches its peak, there’s a high likelihood that it will break out in a downward direction. For the best results, you should use rising wedge patterns in combination with other indicators – such as RSI to confirm lack of momentum in price continuation.
Cleo.finance’s trendline trading tool provides you with a powerful and user-friendly platform to enhance your trading strategies. The tool enables you to identify chart patterns and draw trendlines on the chart, which can be integrated into your automated trading system. With over 55 technical indicators, you can combine your identified chart patterns to achieve the best results and maximize your trading performance and profitability.