

Chart Pattern Series (9/12): Bearish Rectangle Pattern7 min read
Having a grasp on chart patterns is an essential skill that can sharpen your trading edge in the realm of trading. In this 9th article of the chart pattern series, we will be exploring the bearish rectangle pattern.
If you haven’t already, be sure to check out the previous series:
- Symmetrical Triangle Pattern
- Descending Triangle Pattern
- Ascending Triangle Pattern
- Pennant Chart Pattern
- Rising Wedge Chart Pattern
- Falling Wedge Pattern
- Bull Flag Pattern
- Bear Flag Pattern
Table of Contents
What is a Bearish Rectangle Pattern?
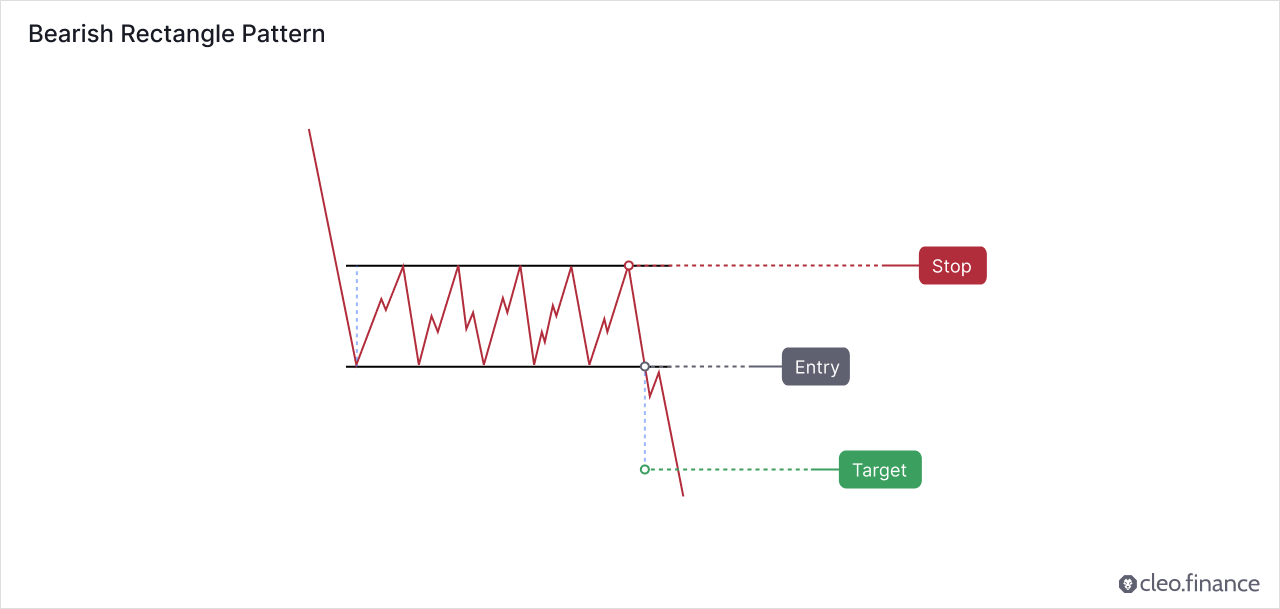
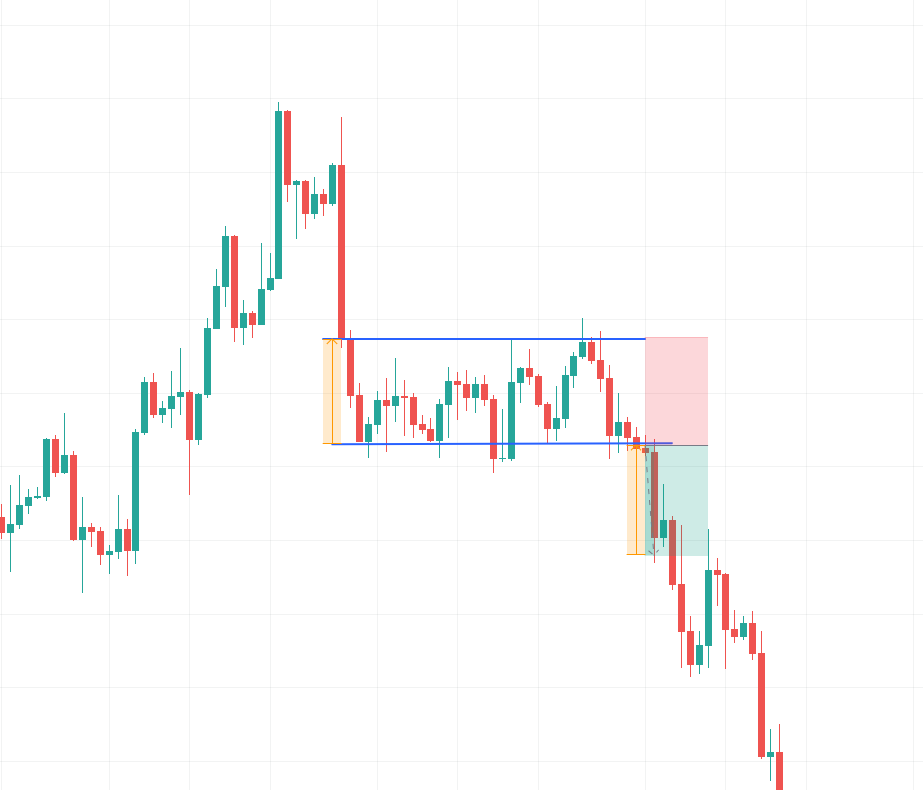
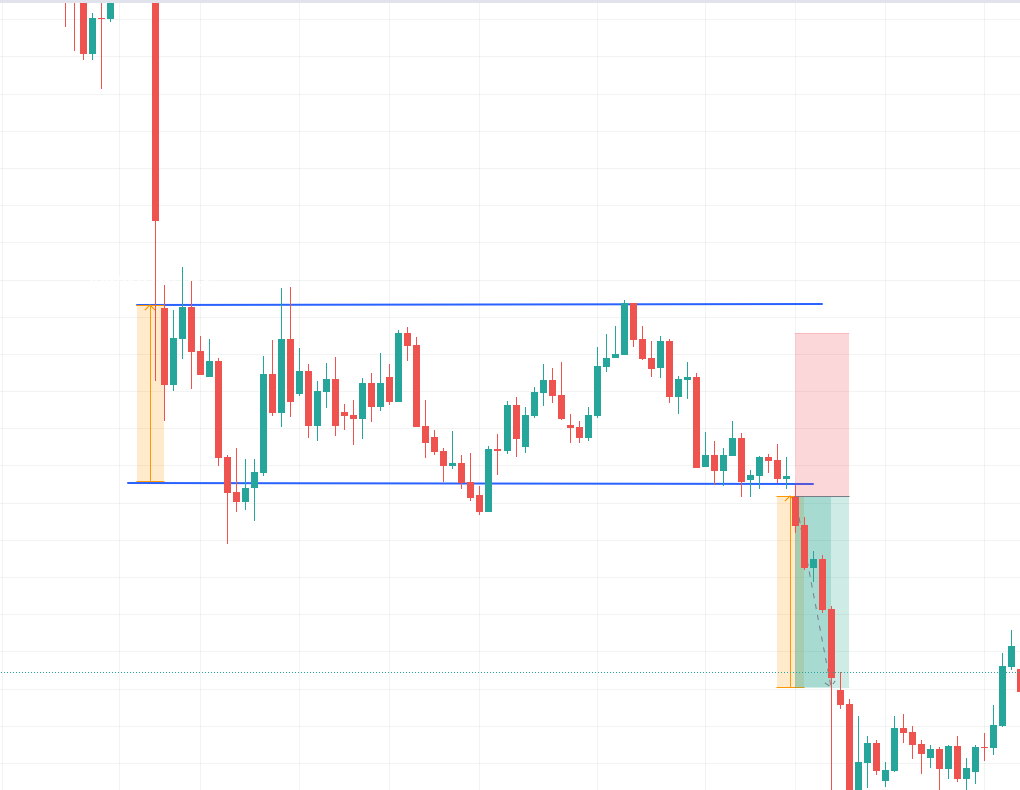
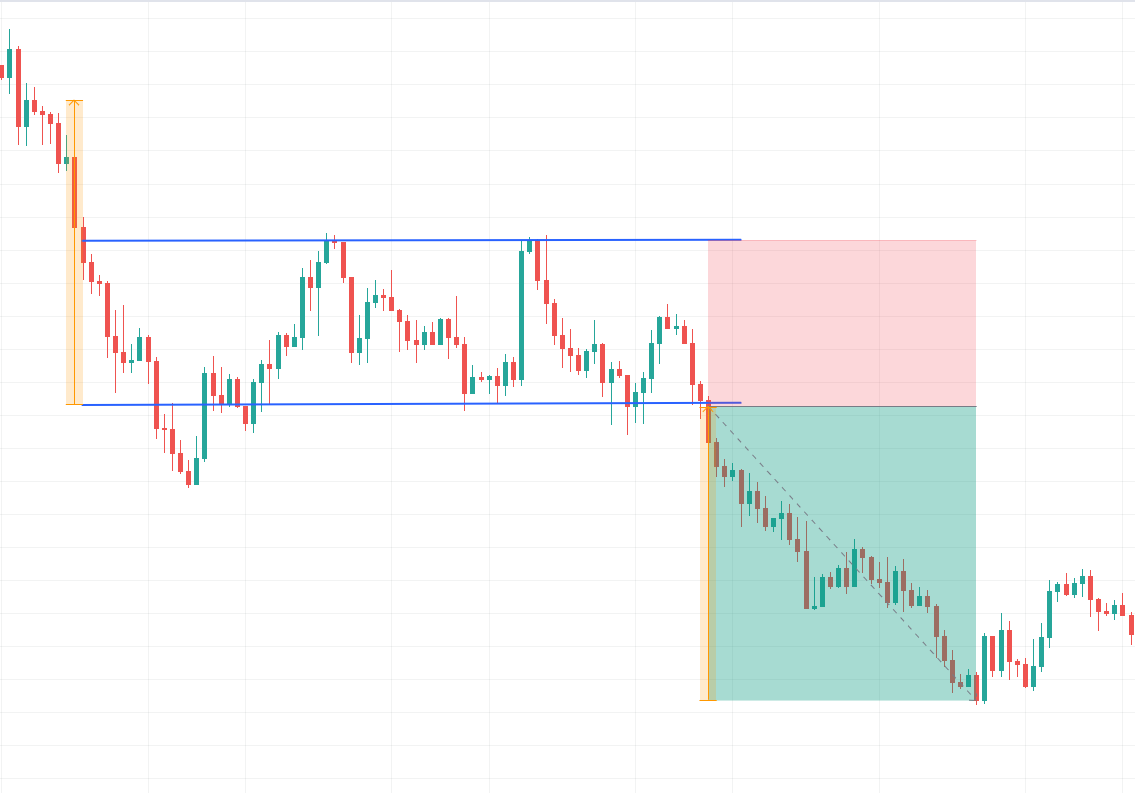
A Bearish Rectangle pattern is characterized by two horizontal trendlines that act as support and resistance lines. The price moves sideways between these trendlines, forming a rectangle. The bearish rectangle pattern shows a consolidation period, neither buyers nor sellers are in control. Price tests both support and resistance lines several times and it often breakouts downward.
The trendlines should be drawn parallel to each other, and it’s crucial that they have at least two touches on both the upper and lower trendlines.
Is the Bearish Rectangle Pattern a Continuation or Reversal Pattern?
The bearish rectangle pattern is generally considered a continuation pattern. It often forms during a downtrend and exhibits a period of consolidation before the price continues downwards. On the other hand, it’s important to keep in mind that in rare cases, the bearish rectangle pattern may also act as a reversal pattern.
How to Identify a Good Bearish Rectangle Pattern?
To identify a good bearish rectangle chart pattern, look for a downward price movement followed by a period of consolidation that represents a rectangle. Bulkowski suggests that the more touches on the lines, the stronger the pattern is likely to be. Additionally as a general rule of thumb, a minimum of two touches on both the support and resistance lines is required.
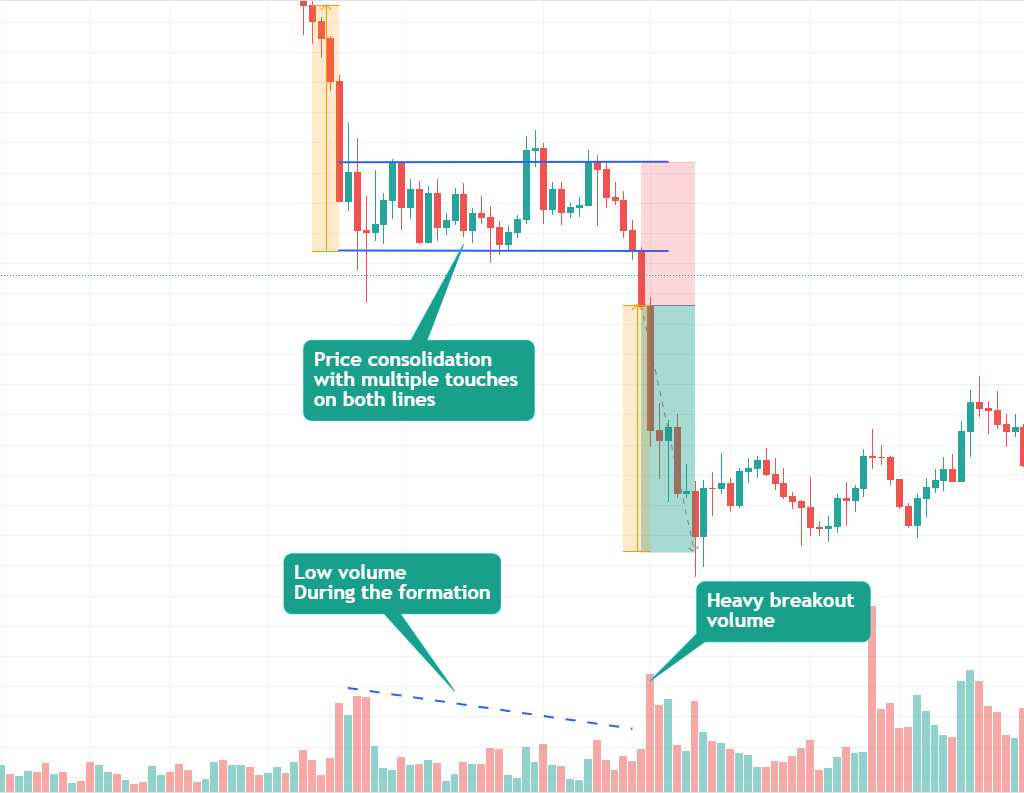
Diminishing volume during the formation of the pattern has little or no effect. However, when volume increases on the breakout itself, it increases the results. Because it confirms that sellers are in control and the price will most likely go downward.
Where to Place Target and Stop Loss?
The target and stop loss can be set in 2 methods for a bearish rectangle pattern.
Method 1:
According to most of the sources, the target can be placed by measuring the height of the rectangle and then placing it below the rectangle’s support line.
The stop loss can be placed just above the resistance level of the pattern.
However, with his method, your RRR will be 1:1 considering the ideal RRR should be at least 1:2.
Method 2:
The target can be placed by measuring the price drop to the point where the pattern’s lower trend line ends and placing it below the support line,
The stop loss can be placed just above the resistance level of the pattern.
In this method, you can achieve higher RRR. Ideally, for every 1 unit of risk, you expect 2 units of reward. You can use both of these methods on cleo.finance by setting multiple take profits.
Thomas Bulkowski carried out the most extensive publicly available research on chart patterns. He analyzed daily data on US equities and identified more than 900 trades based on the bearish rectangle pattern. According to his research, the pullback/throwback rate for the rectangle pattern is typically high. Approximately 6/10 times, the price will retrace back to either the breakout point or the apex point of the pattern.
How to trade Bearish Rectangle Pattern automatically?
On cleo.finance’s trading chart, you can easily find and draw bearish rectangle chart patterns using the trendline tools. Once you’ve spotted the pattern, you can set up automatic trading strategies based on the trendlines you drew. Trendline trading tool allows you to take advantage of potential opportunities when the price breaks below the support line, while also reducing risk by exiting the trade if the price rises above the upper trendline.
Step-by-step guide
1. Identify your pattern on cleo.finance trading chart – two horizontal trendlines that act as support and resistance lines.
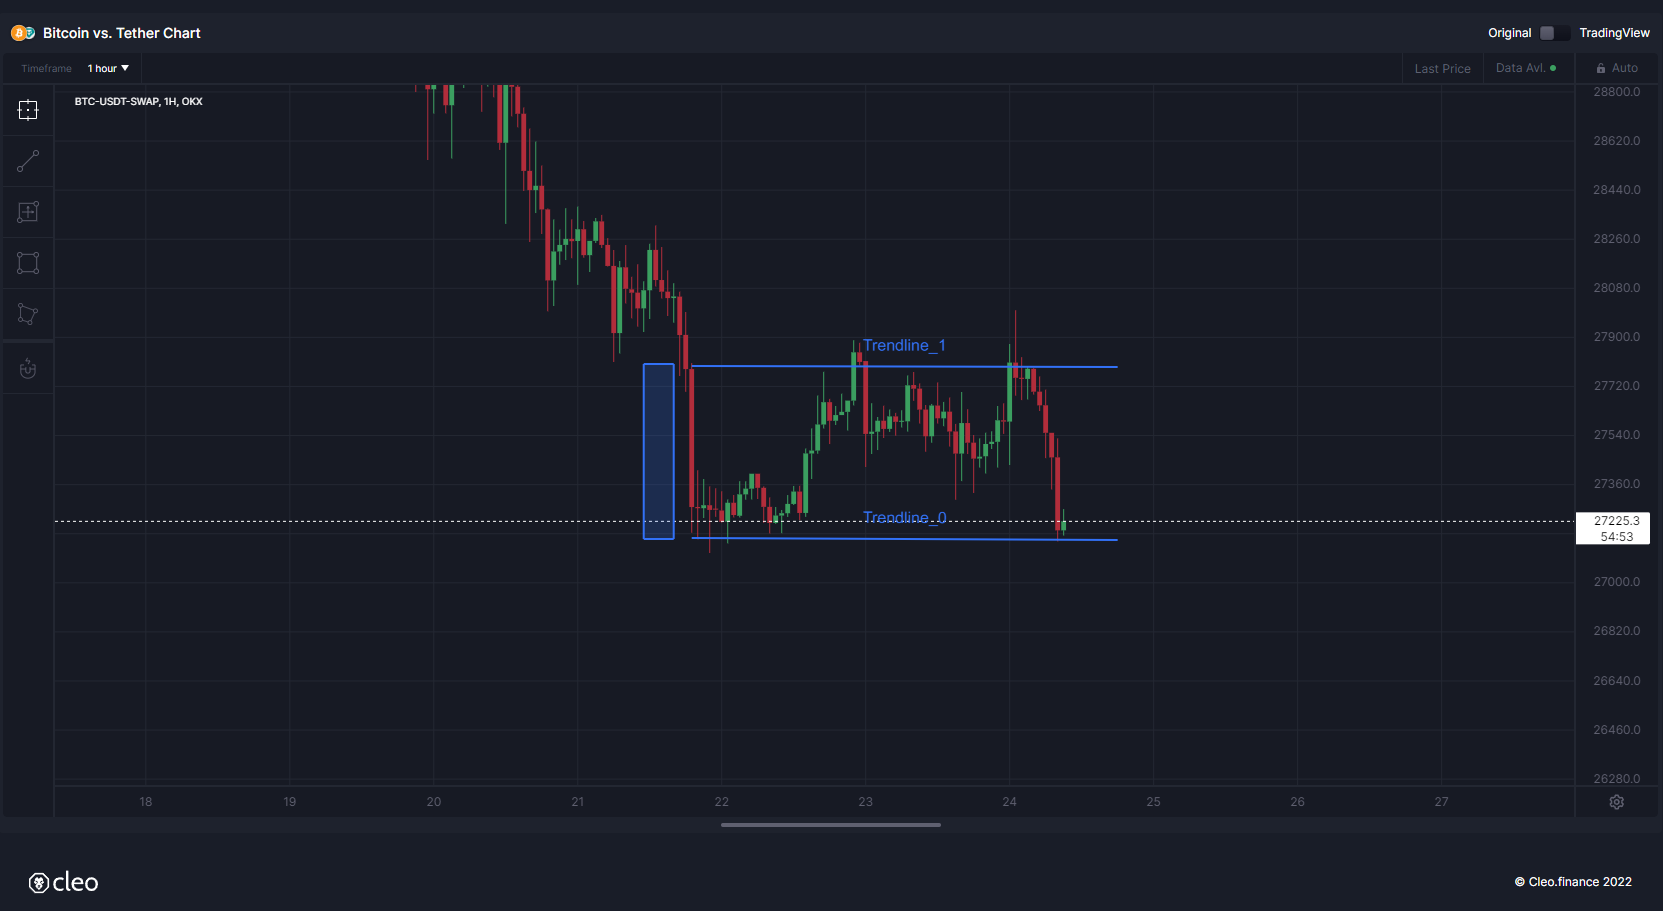
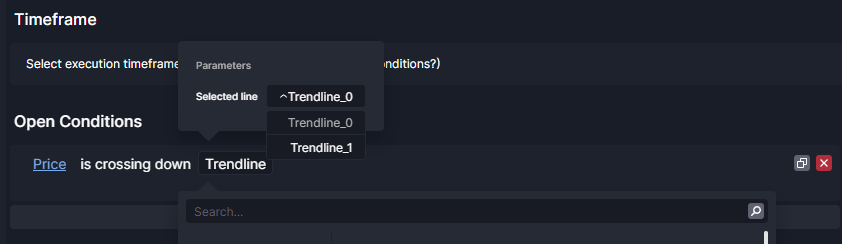
2. Once you draw your chart patterns via trendlines, the trendlines will have an auto-generated name that you’ll need to use in the entry or exit conditions. So you can simply start writing your conditions “Price” and then pick the comparison you want. Your drawn trendlines will be available in the drawing> Trendline section.
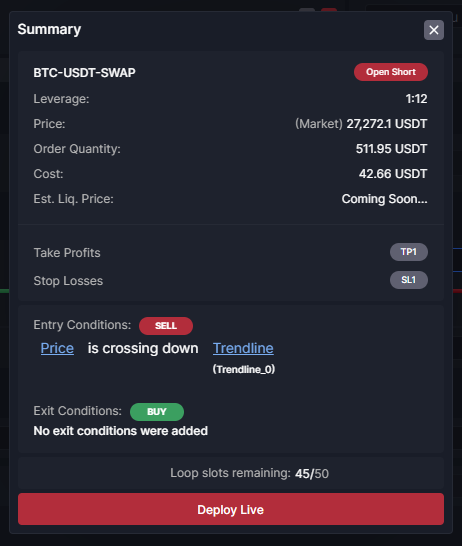
3. Set your volume and then you can place your stop just above the resistance line of the rectangle with around 1:2 RR (Risk to reward ratio). Set your target at the same height as the rectangle below the support line.
4. All set and now you can hit the deploy live button.
Conclusion
The bearish rectangle pattern often occurs in a downtrend market and it is formed by two horizontal lines which act as support and resistance. During the formation of the pattern, price consolidates and at least two touches for both trendlines are necessary to confirm the pattern. The more touches on the support and resistance levels, the stronger the pattern becomes. Breakouts with significant volume increase the performance of the pattern. Additionally, using the pattern with other technical indicators can lead to better trading outcomes.
With Cleo.finance’s trendline trading tool, you can improve your trading strategies effectively without losing a massive amount of time. You can easily identify chart patterns and draw trendlines on the chart to integrate them into your automated trading system. You can combine your identified chart patterns with over 55 technical indicators to achieve the best possible outcomes, allowing you to make more informed trading decisions.