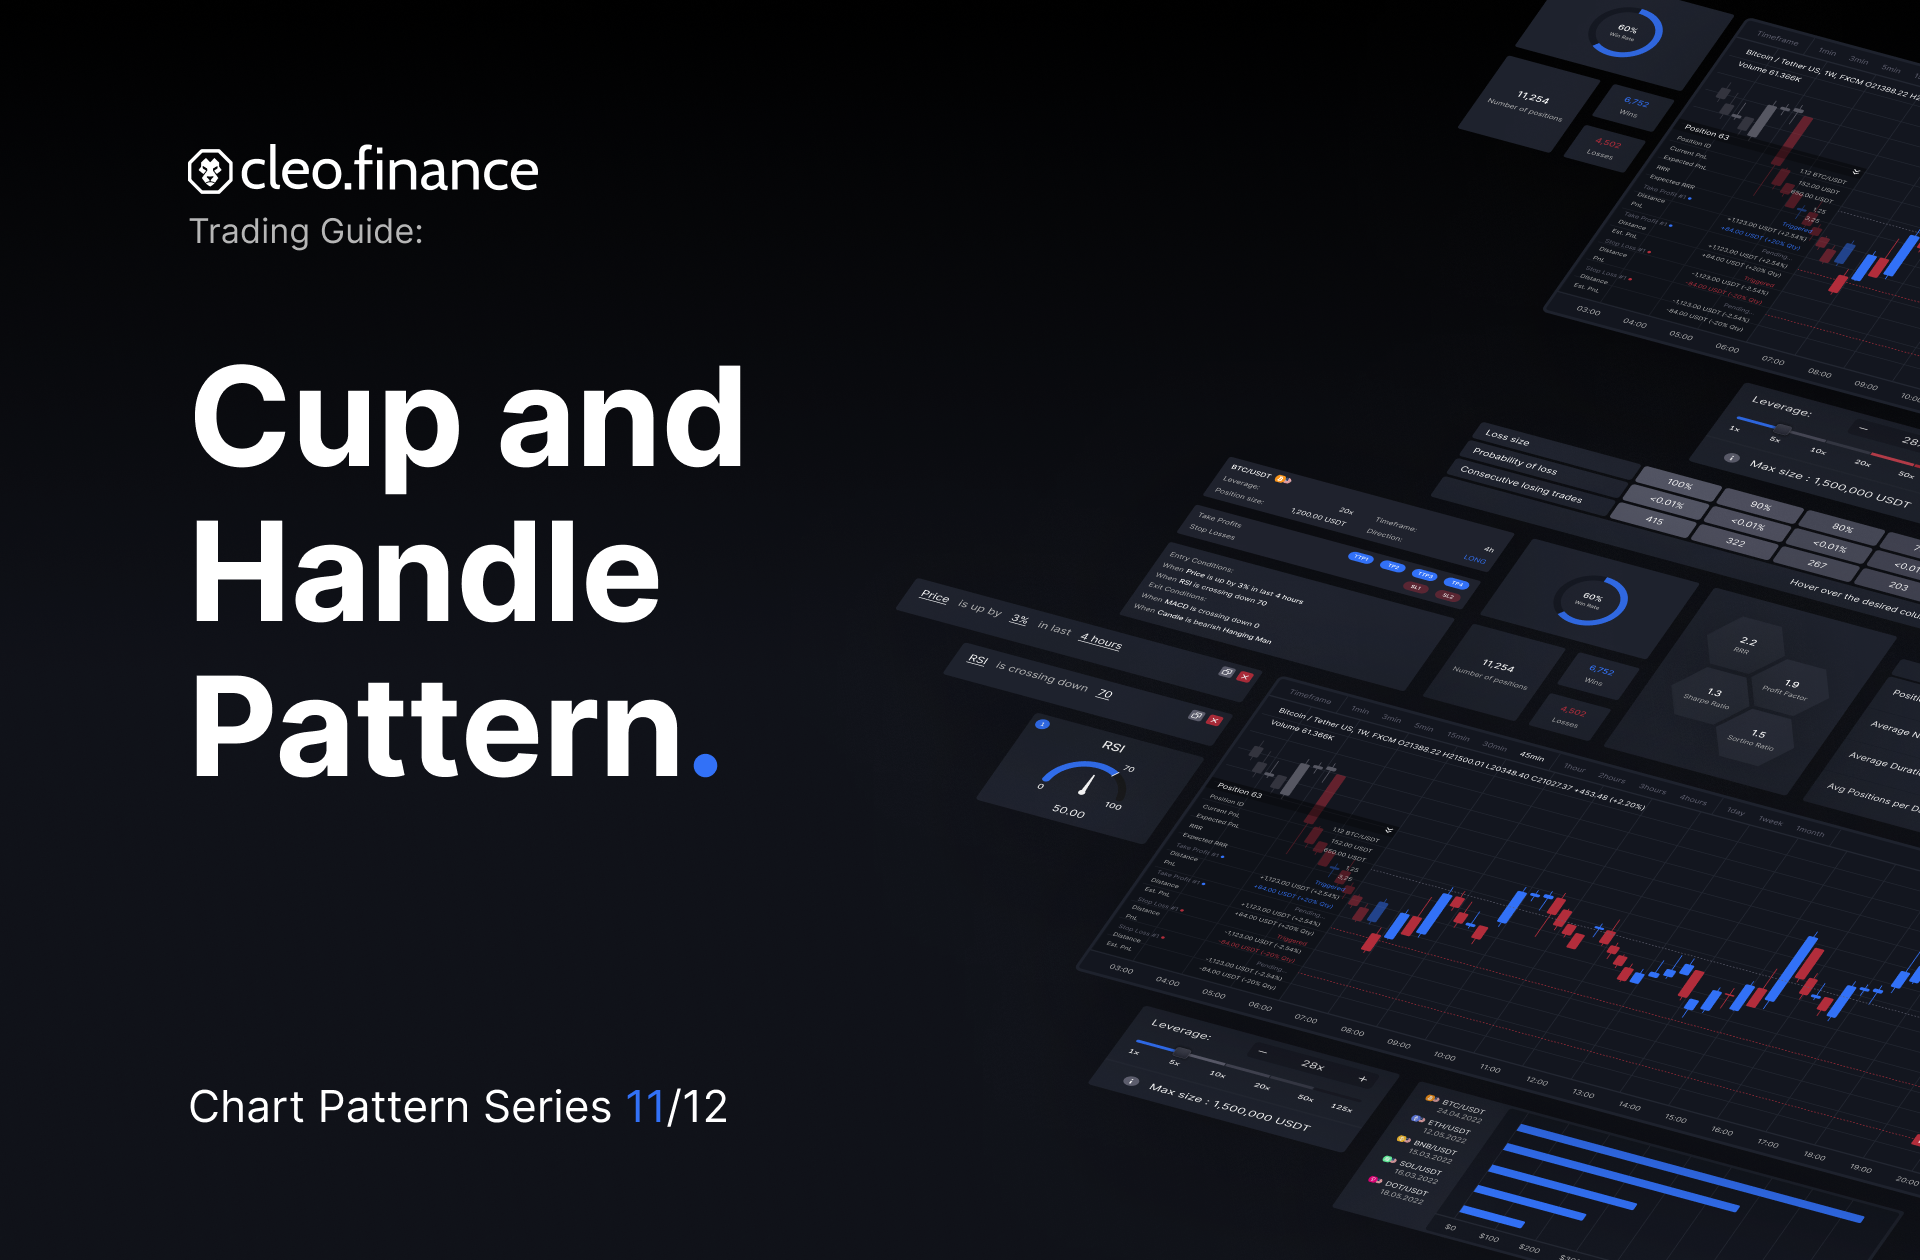
Chart Pattern Series (11/12): Cup and Handle Pattern8 min read
Chart patterns can be an essential tool for leveling up your trading approach and achieving your trading goals When they’re used effectively in conjunction with technical indicators. In this 11th article of the chart pattern series, we will be exploring the cup and handle pattern. Let’s dive right in!
If you haven’t already, be sure to check out the previous series:
- Symmetrical Triangle Pattern
- Descending Triangle Pattern
- Ascending Triangle Pattern
- Pennant Chart Pattern
- Rising Wedge Chart Pattern
- Falling Wedge Pattern
- Bull Flag Pattern
- Bear Flag Pattern
- Bearish Rectangle Pattern
Table of Contents
What is a Cup and Handle Chart Pattern?
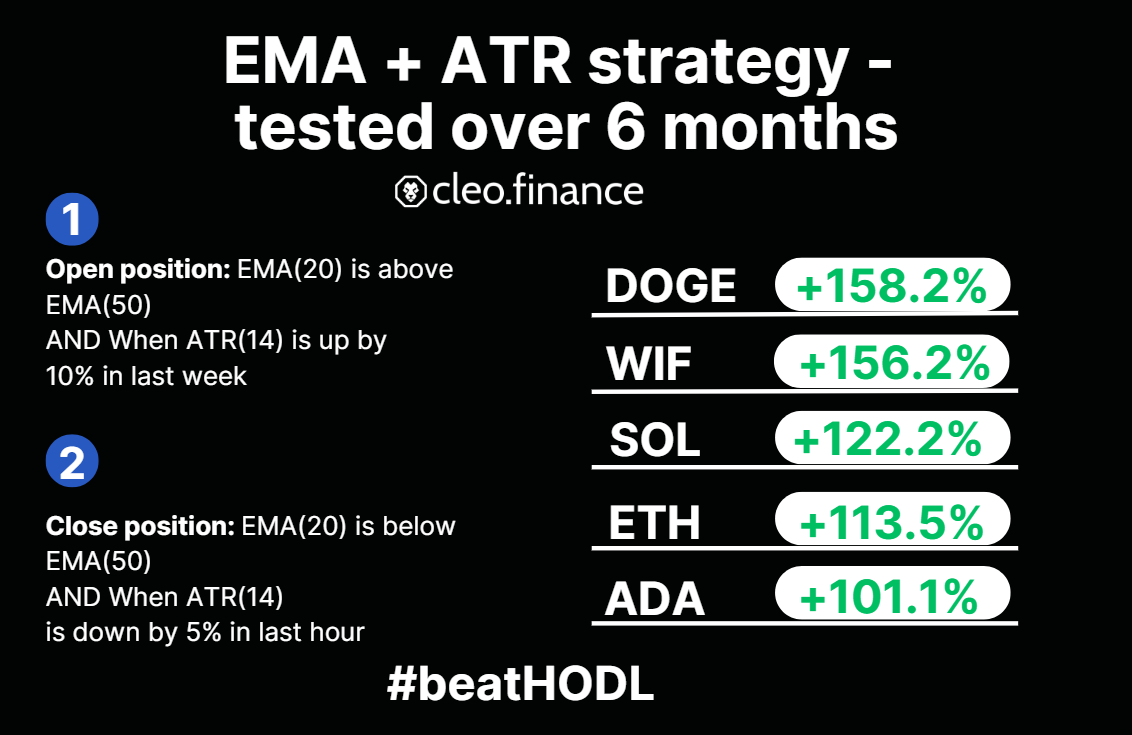
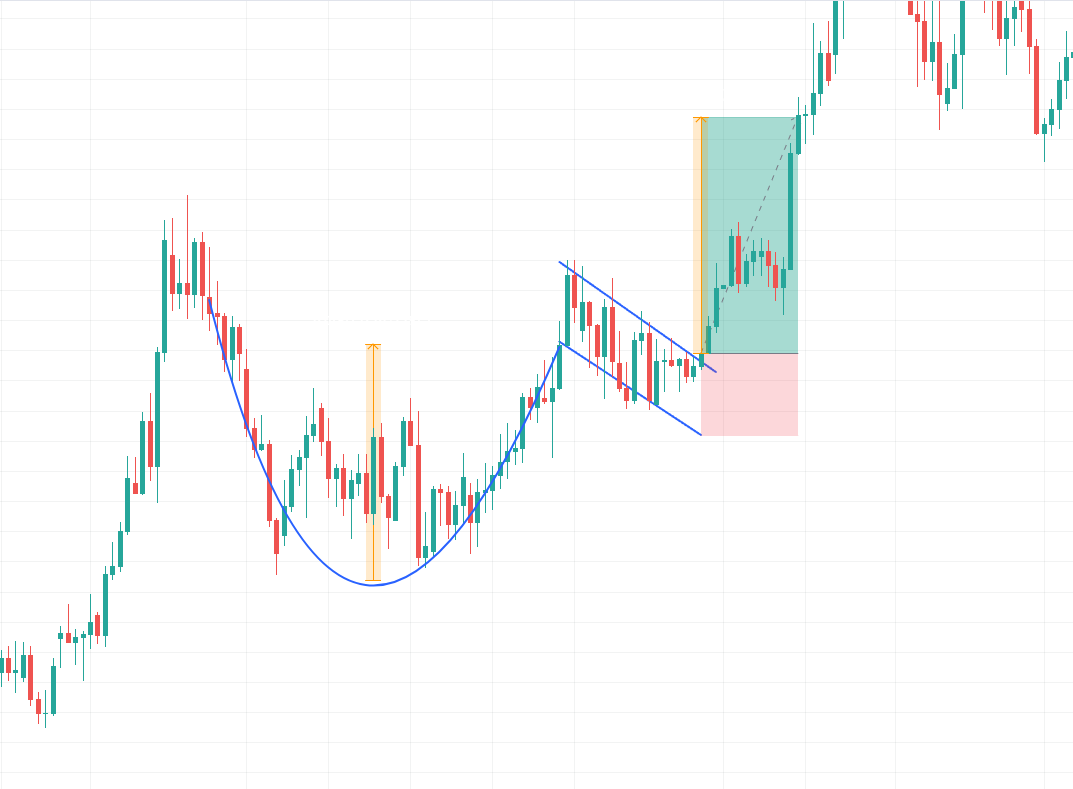
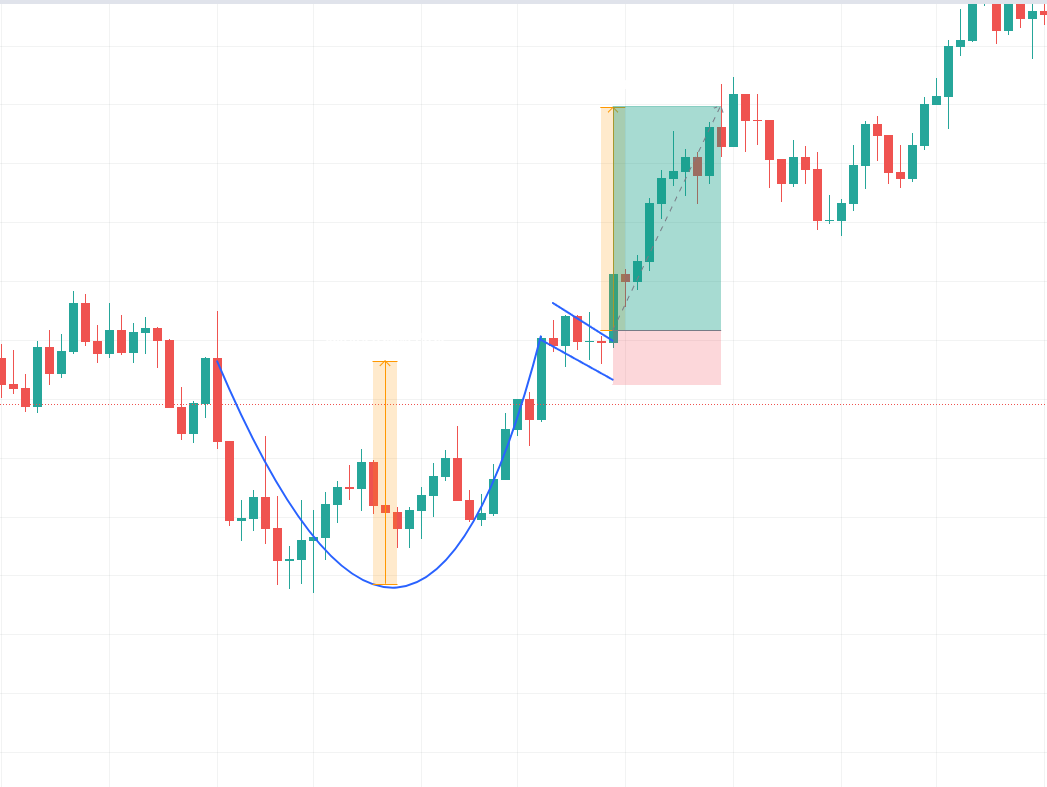
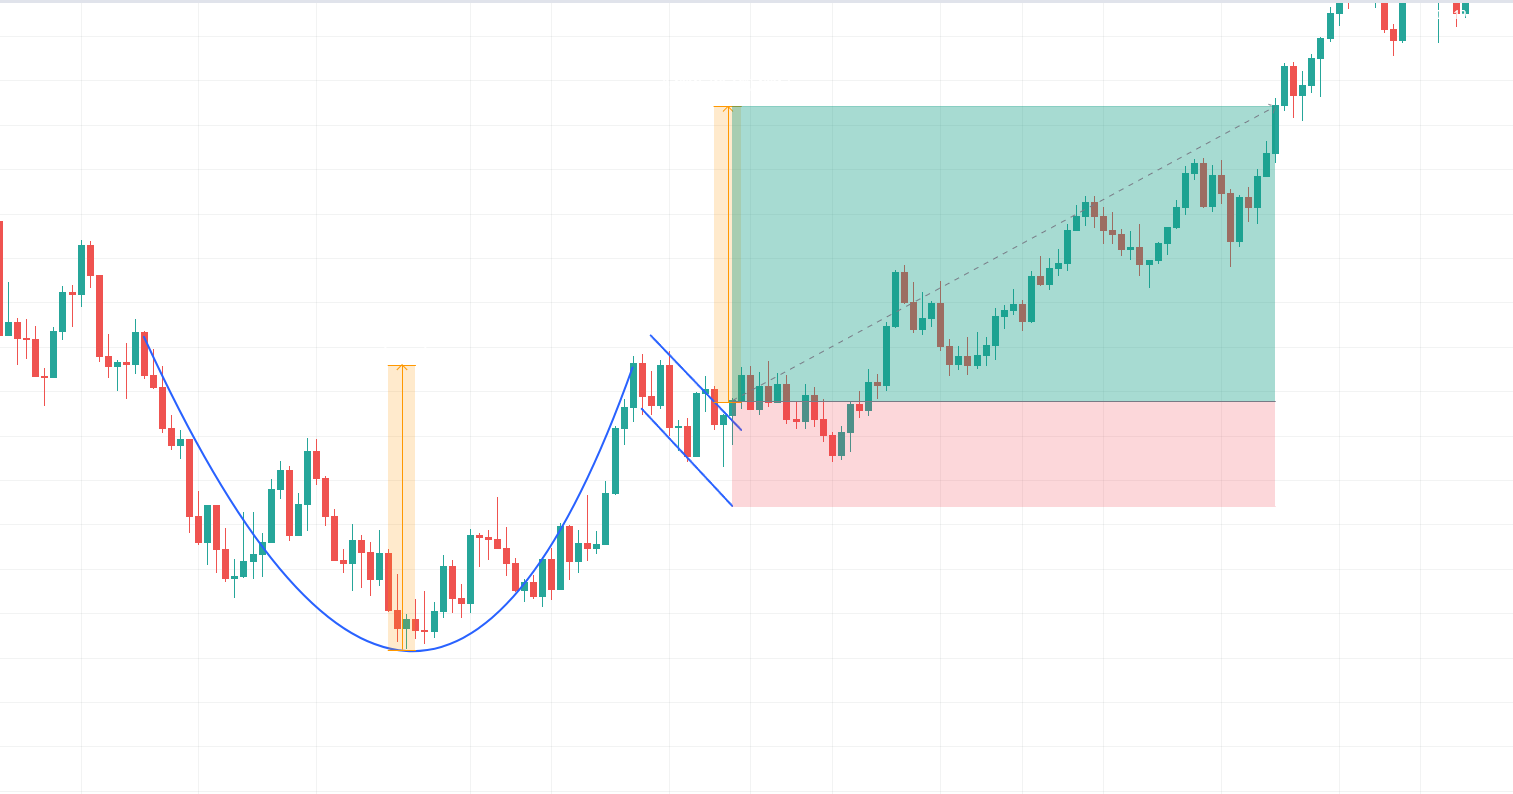
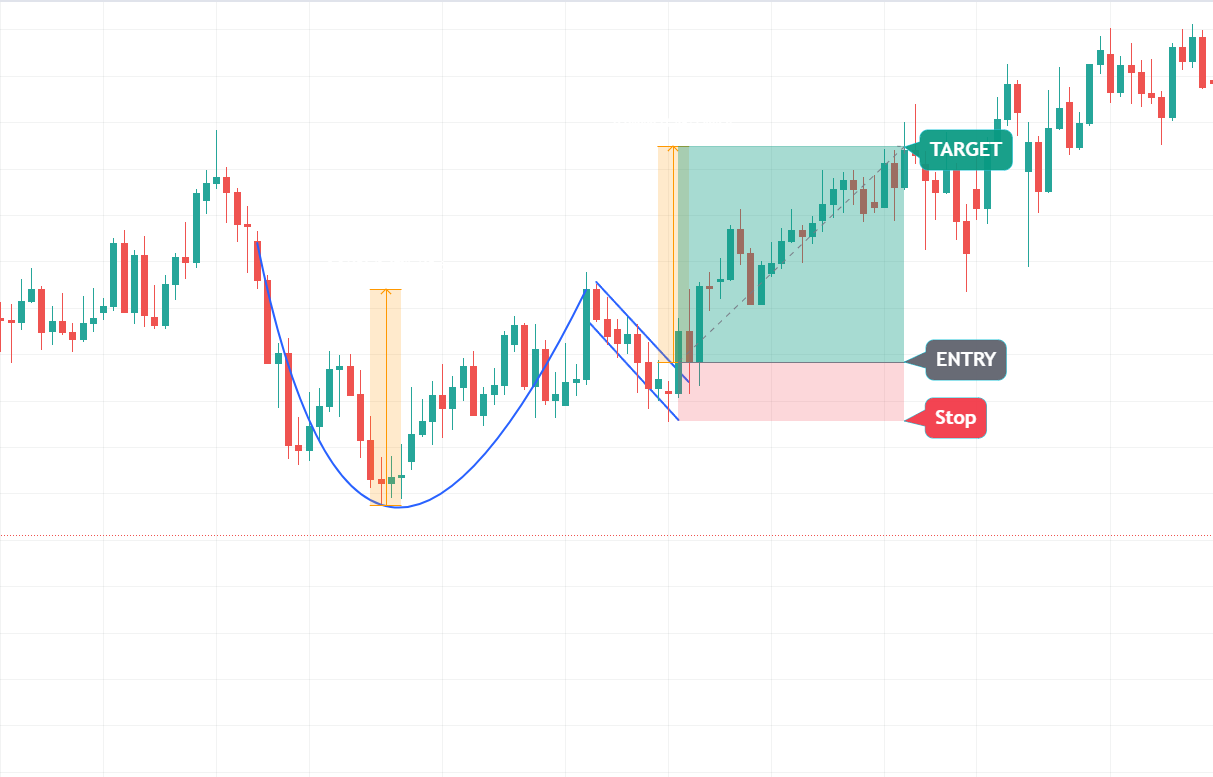
A cup and handle chart pattern forms when the price of an asset makes a gradual u-shape resembling a lip or cup. Once the price reaches the top of the cup, the price moves sideways or slightly downward which forms the handle.
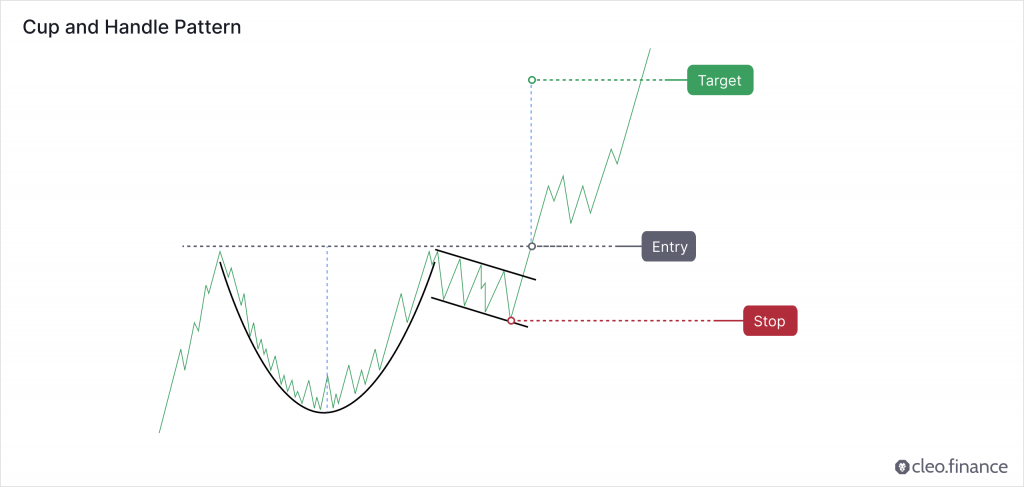
The cup and handle pattern ideally have equal highs on both sides, but in reality, achieving this level of perfection does not exist. Thus, the pattern becomes more desirable as the highs on both sides get closer to being equal. After the high of the cup is reached, a pullback creates the handle, which is a consolidation phase before the breakout. The handle refers to the price action where the price moves in a horizontal or slightly downward direction. When the Cup and Handle pattern completes successfully, the price breaks above the handle’s trendline, leading to new highs.
Is the Cup and Handle Chart Pattern a Continuation or Reversal Pattern?
The pattern is often formed during an uptrend and exhibits a period of consolidation before the price continues upward. Therefore, the cup and handle pattern is considered a continuation pattern. When the price breaks out from the handle’s trading range, it indicates a continuation of the previous trend.
However, in rare cases, the cup will reverse the price trend. It is important to keep in mind that reversal cases are rare, and their performance is significantly lower compared to continuation cases.
Thomas Bulkowski has done one of the most extensive research on chart patterns. He analyzed daily data of US equities and identified more than 913 trades based on the breakout of the cup and handle pattern. The pattern ranked 3rd out of 39 chart patterns in terms of overall performance rank.
How to Identify a Good Cup and Handle Chart Pattern?
Every chart pattern has its own characteristics, and it is essential to know these characteristics in order to use them effectively. For identifying a good cup and handle pattern, there are some guidelines that you can follow. The cup and handle pattern starts to form with a downward price movement. Watch for a period where the price stays relatively stable. Then look for a price uptrend that is more or less the same as the initial decline. This forms the shape we call the cup. The second thing to look for is the forming of the handle. The handle occurs when the price starts moving sideways and slightly downward after the price uptrend.
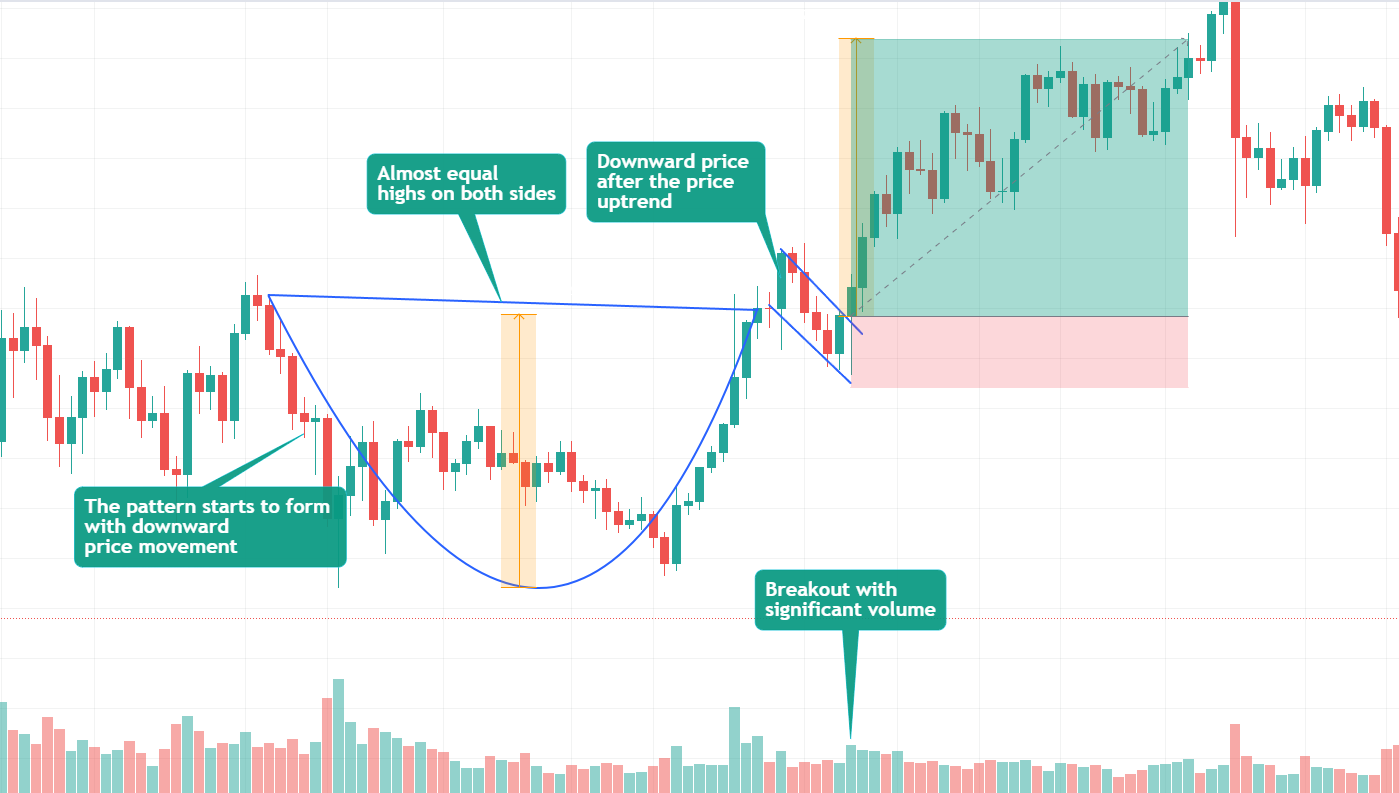
If the handle’s drop reaches below half of the U-shaped cup, then the cup and handle pattern is no longer valid. U-shaped cup formations are ideal, while V-shaped cup formations shouldn’t be considered as the cup and handle pattern. The longer and rounder bottom of the cup is better, as it makes the pattern stronger. The entry signal occurs when the price breaks out through the right side of the cup, and this breakout should happen with significant volume.
Where to Place Target and Stop Loss?
The target can be placed by measuring the height from the bottom of the cup and then placing it above the breakout point. A stop loss can be placed below the low of the handle of the pattern.
According to Thomas Bulkowski’s research, the pullback/throwback rate for the cup and handle pattern can be considered to be high. About 6/10 times, the price will retrace back to either the breakout point or the apex point of the pattern.
How to trade an Ascending Triangle Pattern automatically?
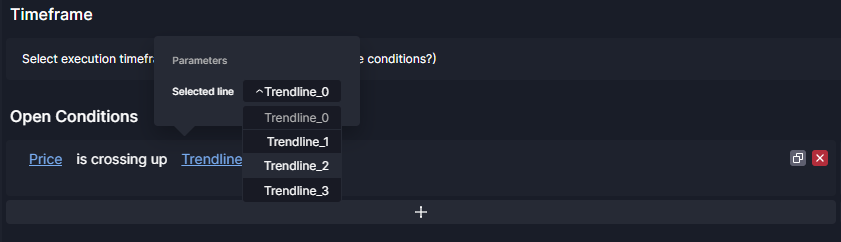
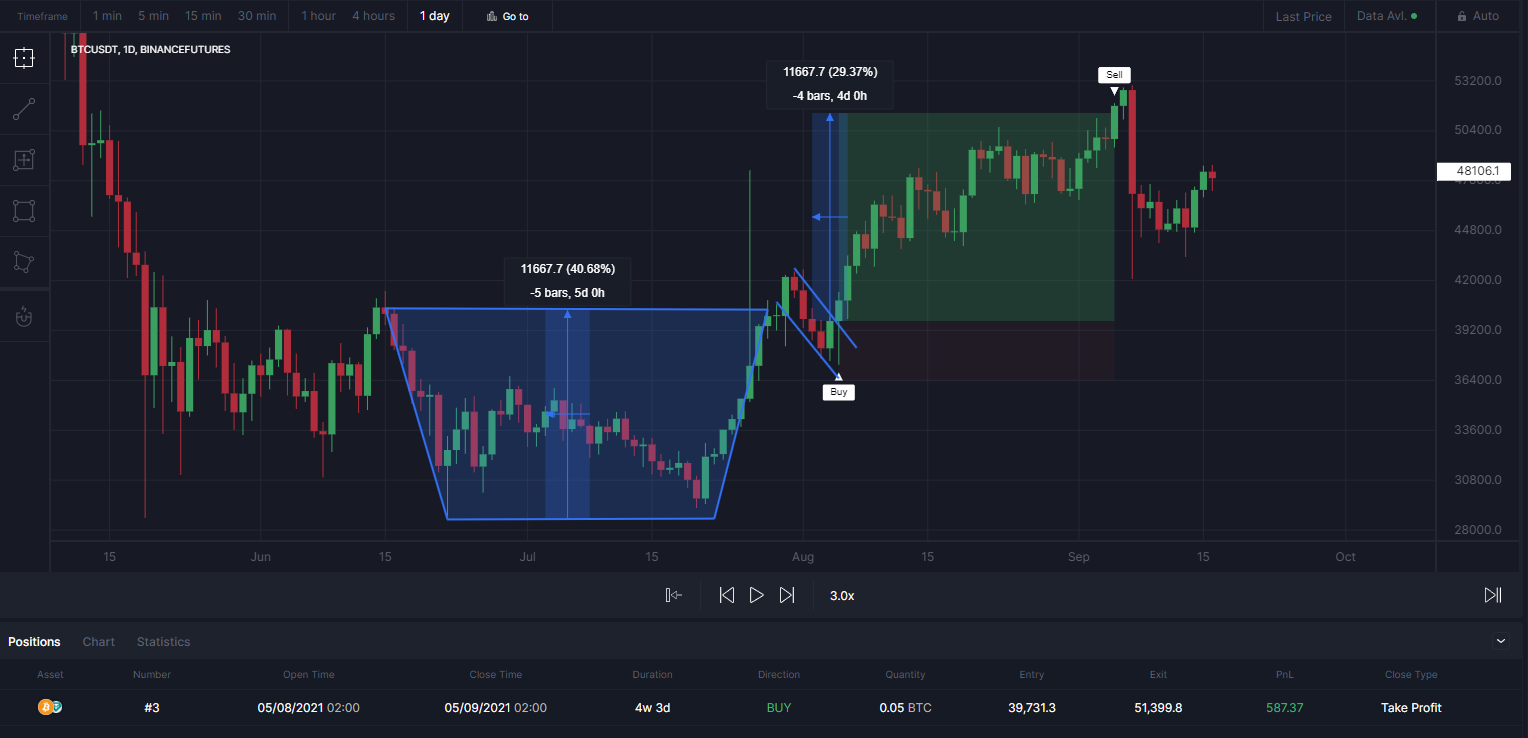
On cleo.finance, you can use trendline trading tools to easily identify and draw the cup and handle pattern. Once you’ve identified the pattern, you can automate your trading strategy by selecting the entry and exit conditions based on the chart pattern. For instance, you can enter the trade when the price breaks out above the handle, with a stop loss placed below the handle. This can help you take advantage of potential breakout opportunities while limiting your downside risk by exiting the trade if the price falls below the stop loss level.
Step-by-step guide
1. Identify your cup and handle pattern on cleo.finance trading chart – a gradual U-shaped cup form and the handle that forms after the cup.
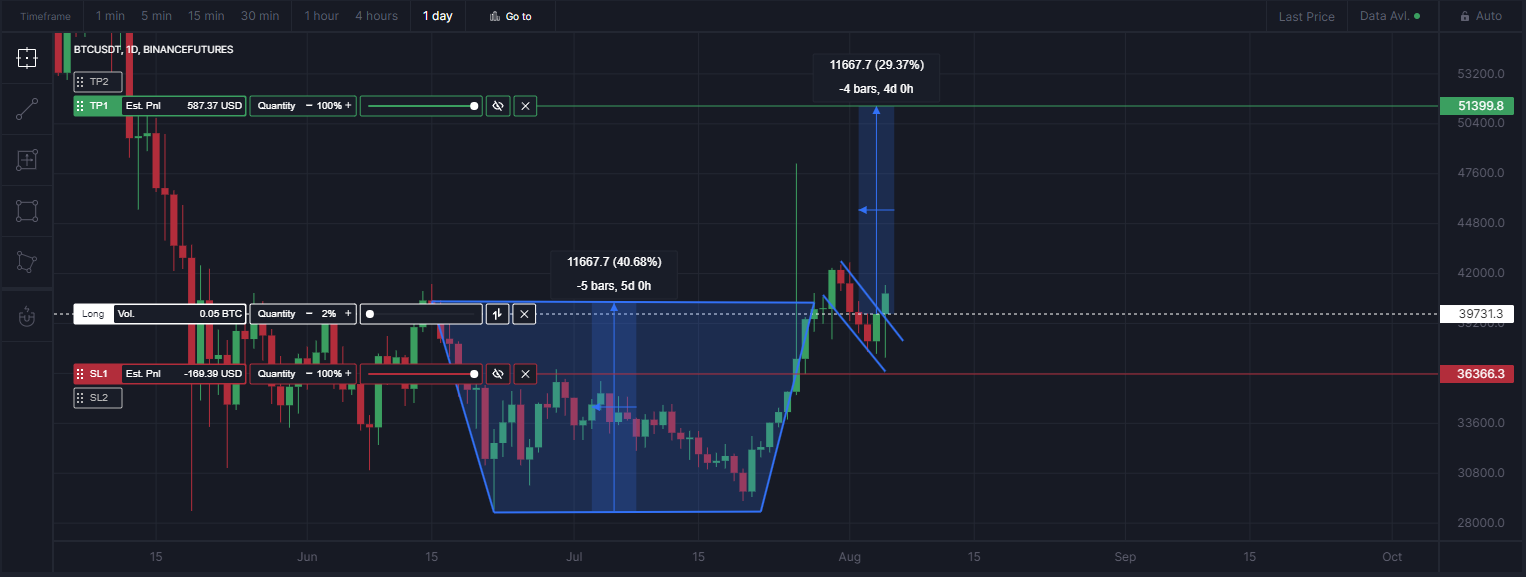
2. Once you draw your chart patterns via trendlines, the trendlines will have an auto-generated name that you’ll need to use in the entry or exit conditions. So you can simply start writing your conditions “Price” and then pick the comparison you want. Your drawn trendlines will be available in the drawing> Trendline section.
3. Set your volume and then you can place your stop below the handle. Set your target by measuring height from bottom of the cup and then placing it above the breakout point.
4. All set and now you can hit the deploy live button.
Conclusion
The cup and handle pattern is characterized by a gradual U-shaped cup and a handle where the price moves sideways or slightly downward. Cups with more rounded bottoms are more desirable, and V-shaped cups should be avoided when spotting the pattern. A breakout with significant volume improves the reliability of the pattern, and the handle of the pattern should not reach beyond half of the cup. As with other patterns, the cup and handle pattern yields optimal results when used in conjunction with other technical indicators.
Cleo.finance’s trendline trading tool allows traders an optimal way to enhance their strategies while saving time. With the trendline tool, traders can identify chart patterns and draw trendlines on the chart and incorporate them into their automated trading system. With over 55 technical indicators they can they can easily combined technical indicators with their identified chart patterns to optimize their trading approach and improve outcomes. Trendline trading tool gives traders a space to achieve better results with less effort.