

Chart Pattern Series (10/12): Bullish Rectangle Pattern7 min read
Identifying chart patterns can help you understand the market’s behavior and make more informed trading decisions. These patterns can indicate areas of support and resistance, providing insights into potential price movements. In this 10th article of the chart pattern series, we will dive into the bearish rectangle pattern.
If you haven’t already, be sure to check out the previous series:
- Symmetrical Triangle Pattern
- Descending Triangle Pattern
- Ascending Triangle Pattern
- Pennant Chart Pattern
- Rising Wedge Chart Pattern
- Falling Wedge Pattern
- Bull Flag Pattern
- Bear Flag Pattern
- Bearish Rectangle Pattern
Table of Contents
What is a Bullish Rectangle Pattern?
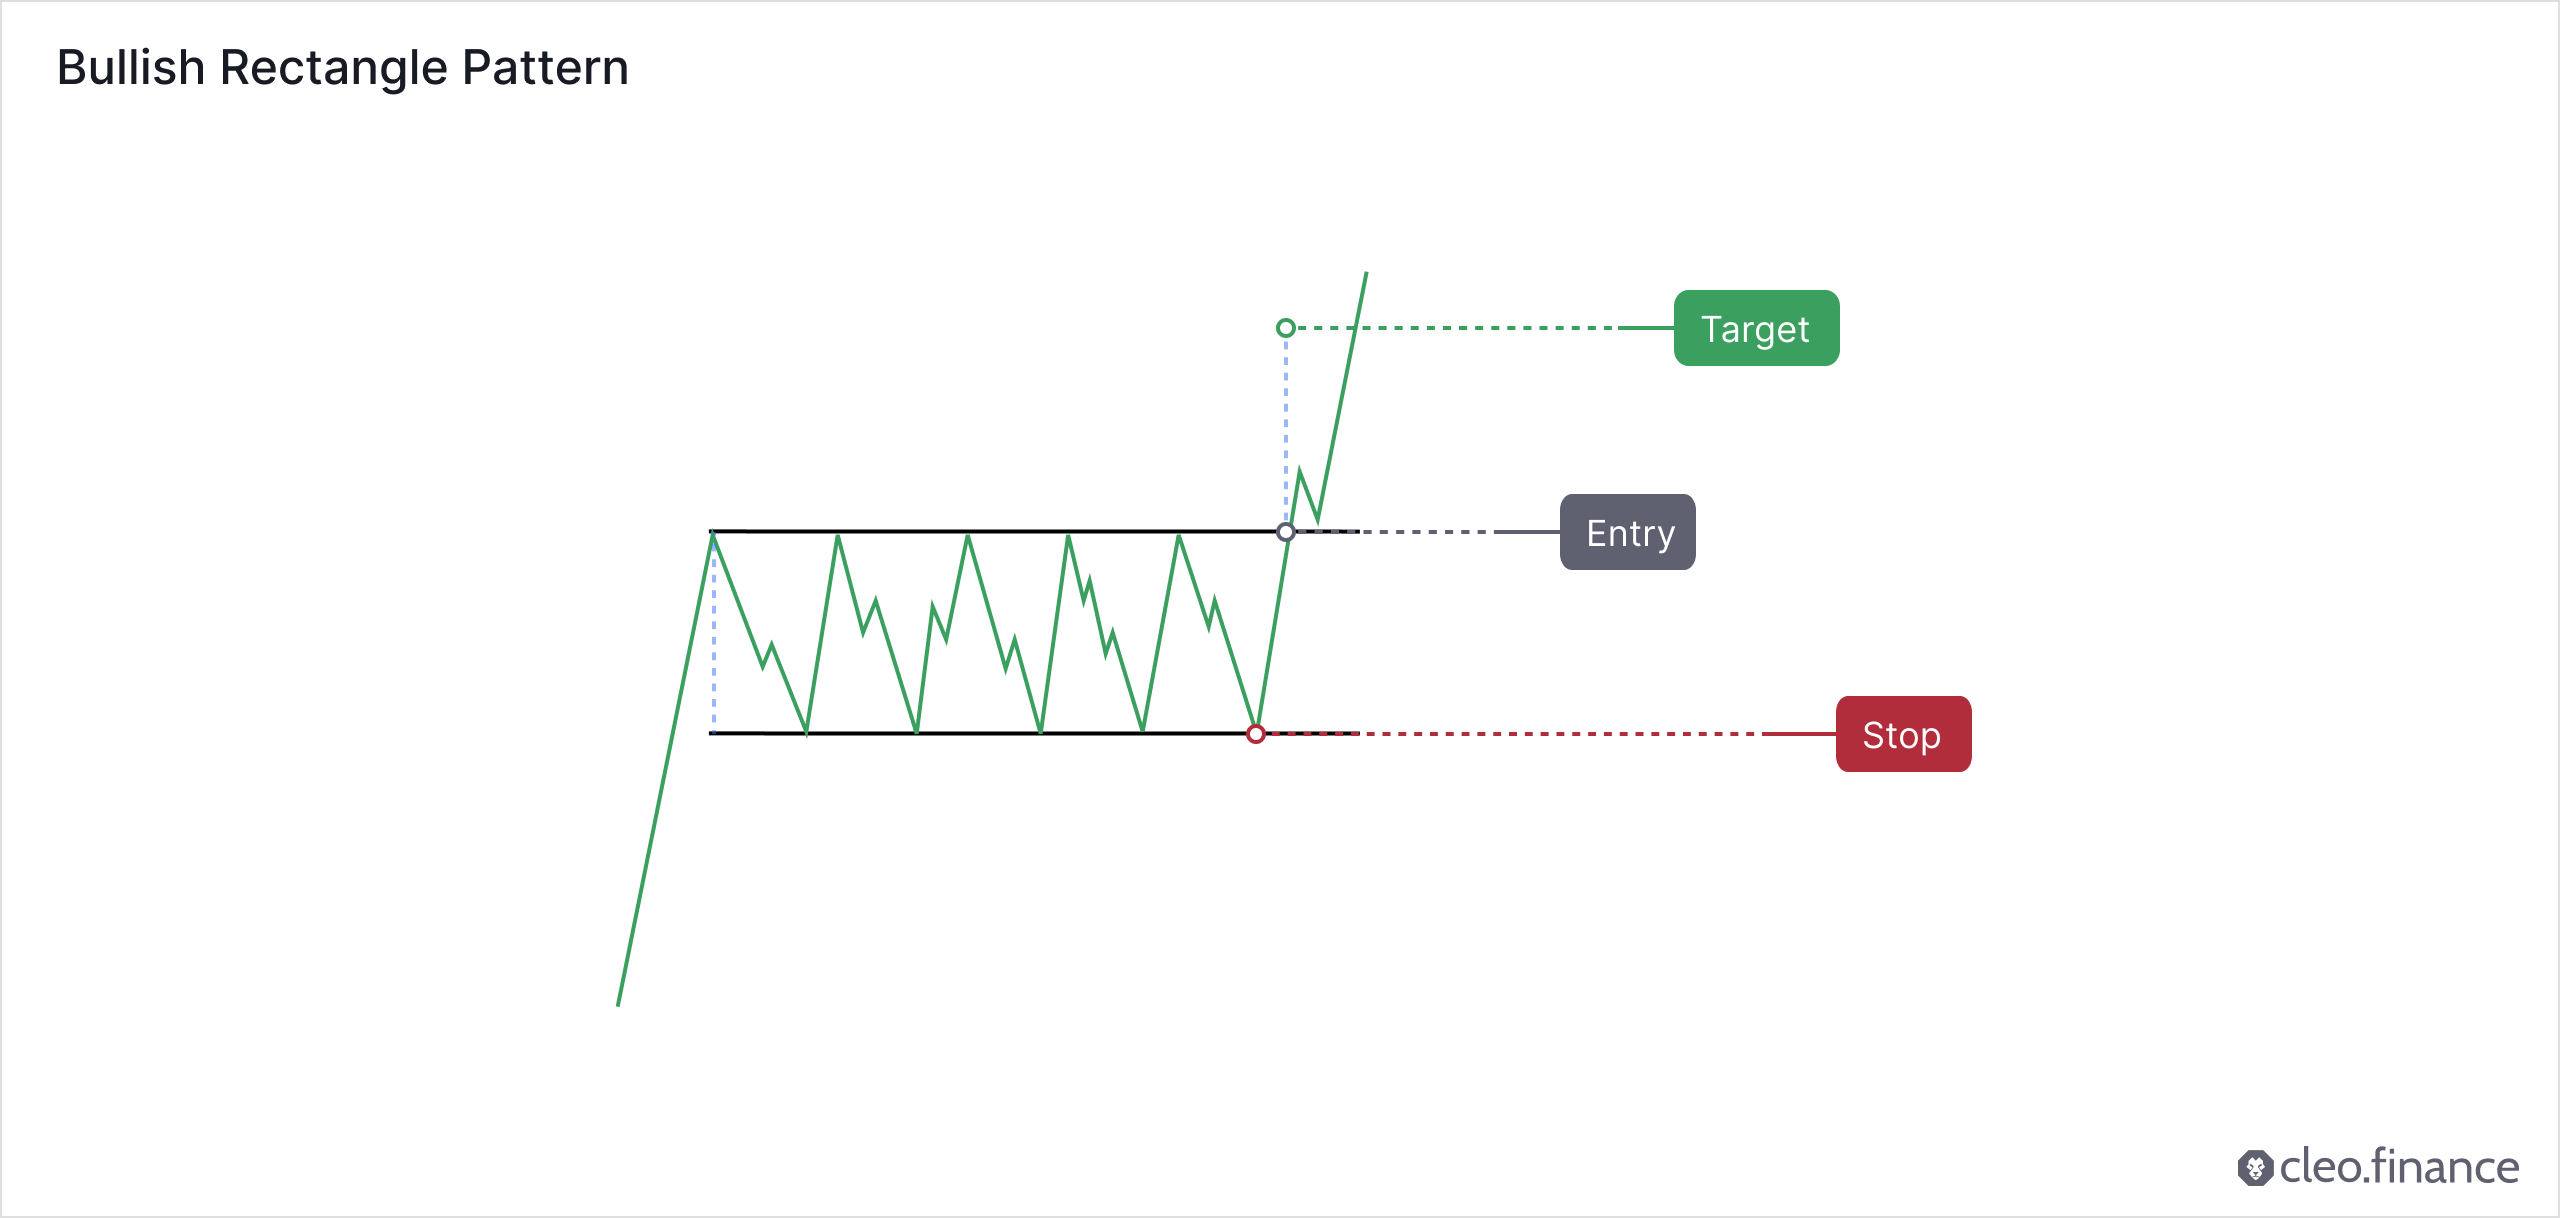
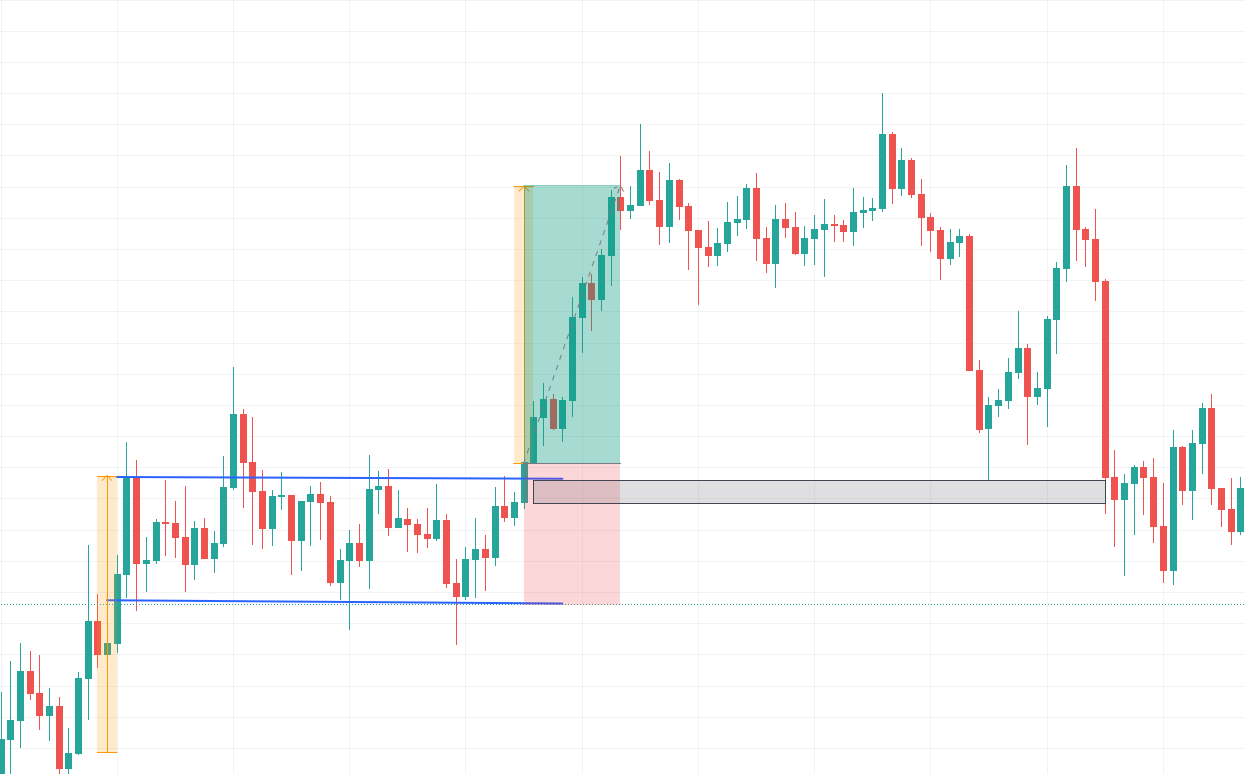
A bullish rectangle pattern is characterized by two horizontal trendlines acting as support and resistance levels, forming a rectangle-shaped pattern. During the pattern’s formation, the price moves sideways between the two trendlines, indicating a consolidation period where neither buyers nor sellers are in control.
To identify a bullish rectangle pattern, the trendlines should be parallel to each other, with at least two touches on both the upper and lower trendlines. The more touches on the lines, the stronger the pattern is likely to be.
Is the Bullish Rectangle Pattern a Continuation or Reversal Pattern?
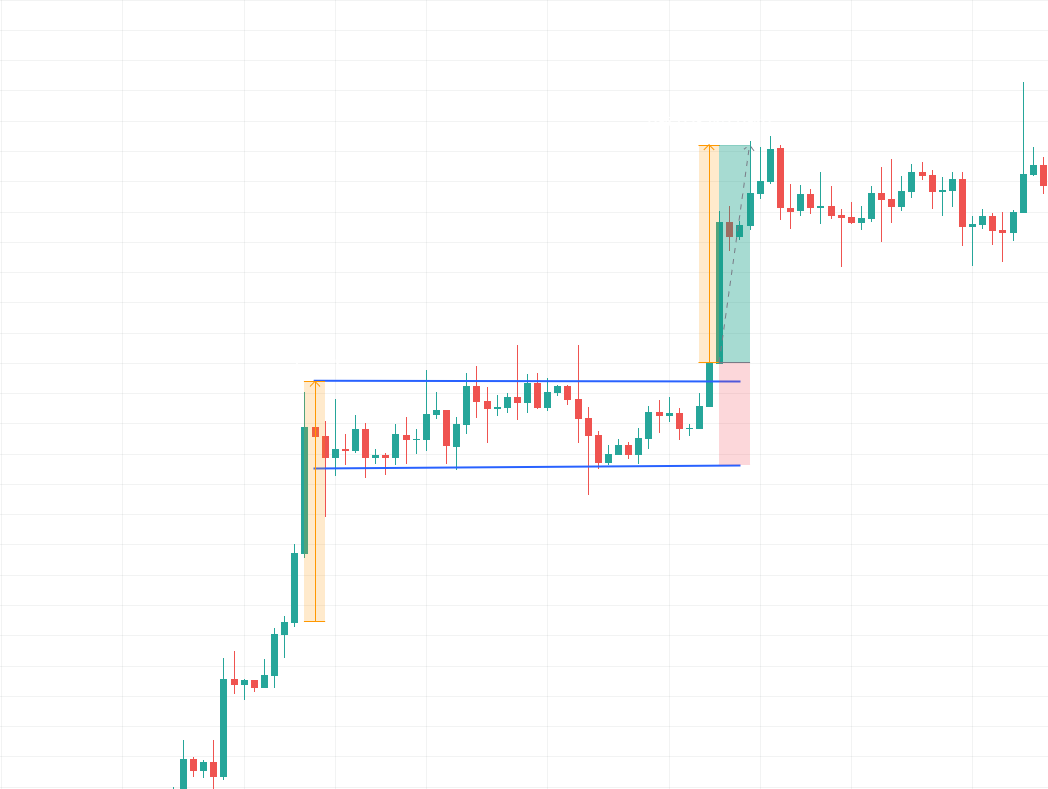
The bullish rectangle pattern indicates a pause in the uptrend before the price eventually continues upwards and the pattern is generally considered a continuation pattern. It often forms during an uptrend and exhibits a period of consolidation before the price continues upward. However, in rare cases, the bullish rectangle pattern may act as a reversal pattern.
The bullish rectangle pattern indicates a pause in the uptrend before the price eventually continues upwards.
How to Identify a Good Bullish Rectangle Pattern?
To identify a good bullish rectangle chart pattern, look for an upward price movement followed by a period of consolidation. In a bullish rectangle pattern, a minimum of two touches on both the support and resistance lines is desired. The pattern’s performance is increased when there are more touches on the trendlines.
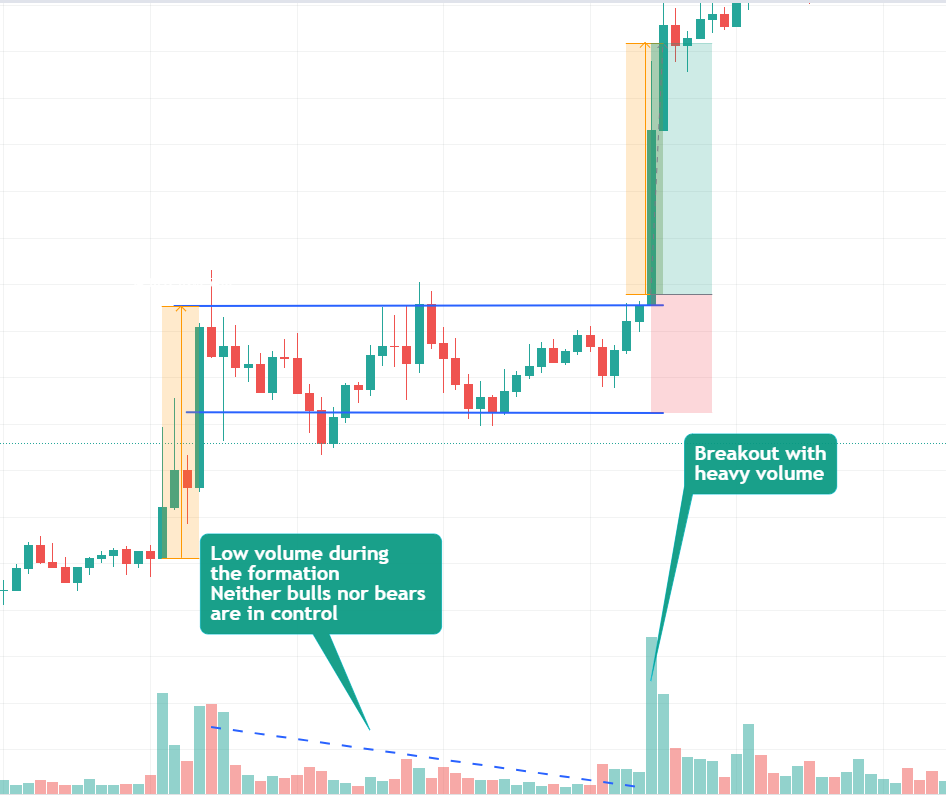
Decreasing volume during the bullish rectangle pattern has little or no effect at all. But, it is important to look out for a breakout with a significant breakout because it confirms that buyers are in control, and the price will most likely continue upwards.
Where to Place Target and Stop Loss?
The target and stop loss for the bullish rectangle pattern can be set using the following methods:
Method 1:
The target can be placed by measuring the height of the rectangle and then placing it above the rectangle’s resistance line.
The stop loss can be placed just below the support level of the pattern. However, this method results in a risk-to-reward ratio of 1:1, which is not ideal.
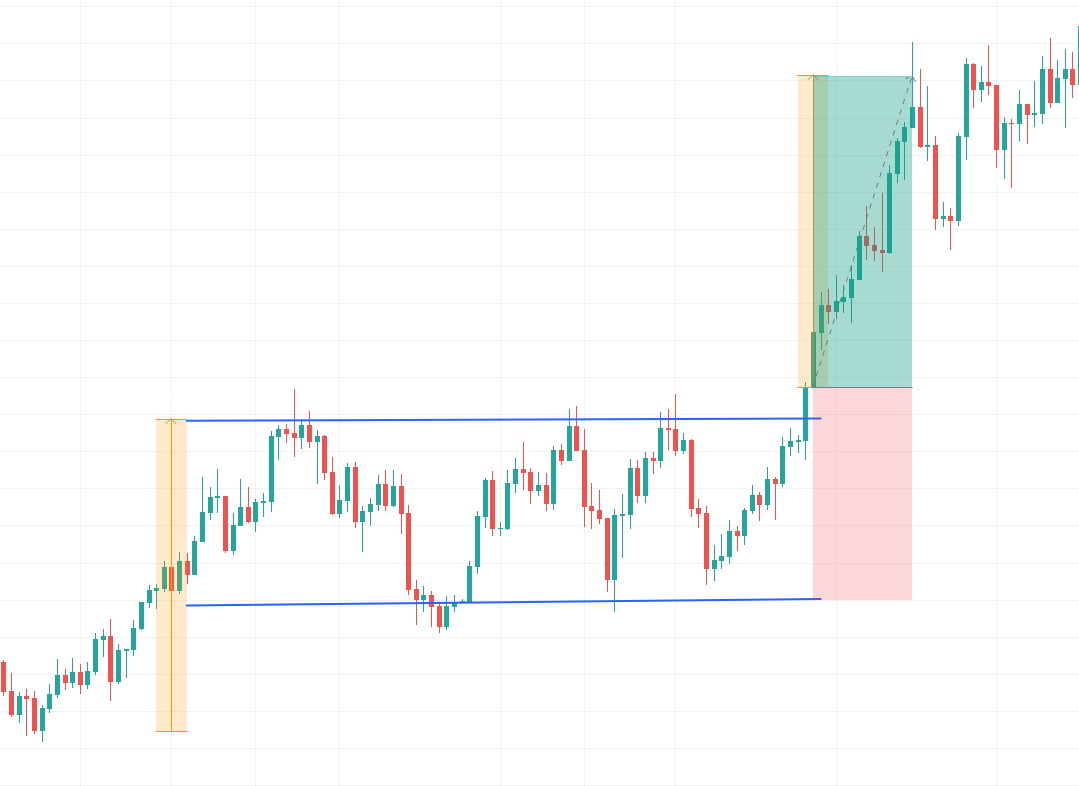
Method 2:
To set the target, measure the price increase to where the pattern’s upper trendline ends, then place it above the resistance line – similar to setting a target using the flagpole in a flag pattern.
The stop loss can be placed just below the support level of the pattern. This method allows for a higher risk-to-reward ratio of 1:2 or better.

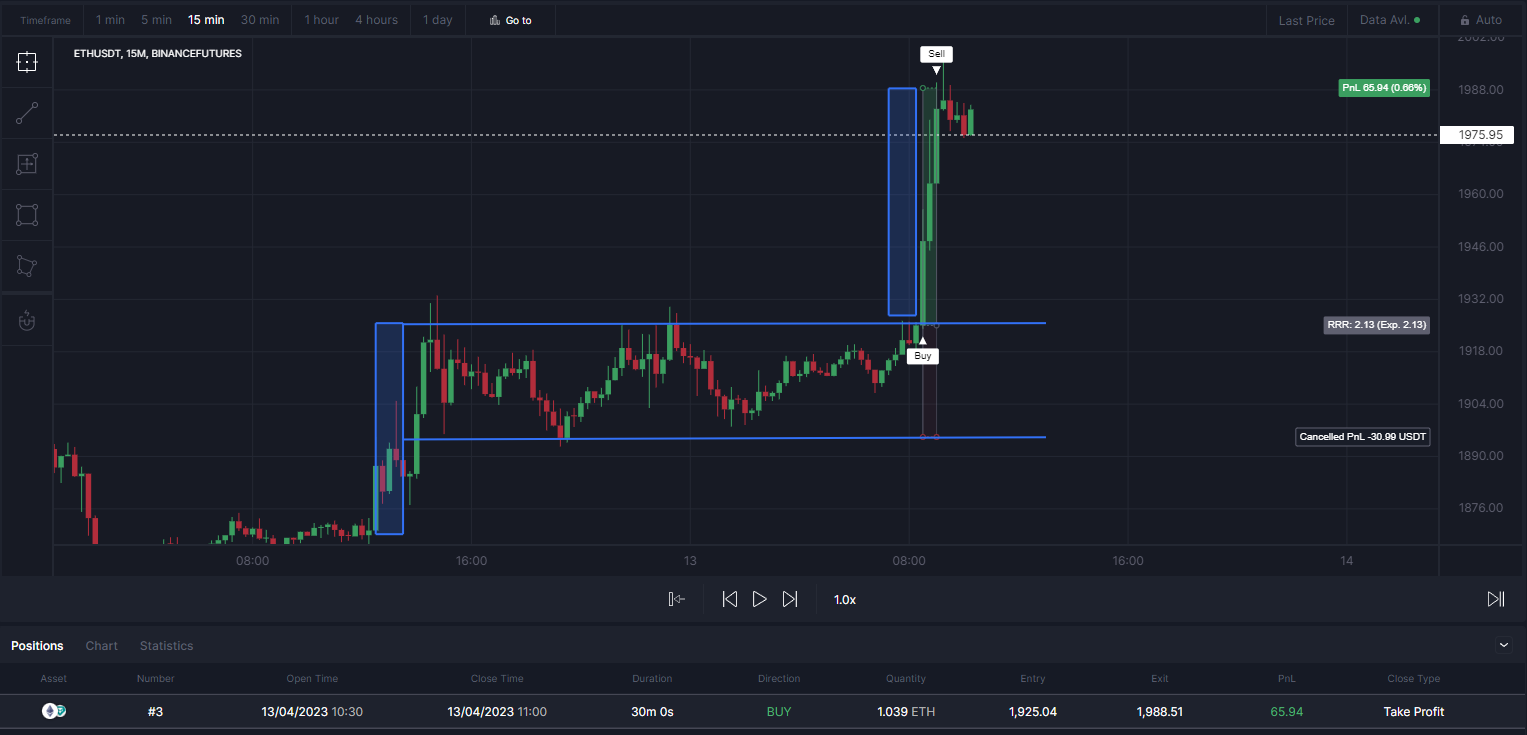
Thomas Bulkowski carried out the most extensive publicly available research on chart patterns. He analyzed daily data on US equities and identified more than 1000 trades based on the bullish rectangle pattern. According to his research, the pullback/throwback rate for the rectangle pattern is typically high.
Approximately 6/10 times, the price will retrace back to either the breakout point or the apex point of the pattern.
How to trade Bullish Rectangle Pattern automatically?
On cleo.finance’s trading chart, you can easily find and draw a bullish rectangle pattern using the trendline tools. Once identified, you can set up automated trading strategies based on the trendlines you drew. By utilizing the trendline trading tool, you can capitalize on potential opportunities when the price breaks above the resistance line while minimizing risk by exiting the trade if the price falls below the lower trendline.
Step-by-step guide
1. Identify your pattern on cleo.finance trading chart – two horizontal trendlines that act as support and resistance lines.
2. Once you draw your chart patterns via trendlines, the trendlines will have an auto-generated name that you’ll need to use in the entry or exit conditions. So you can simply start writing your conditions “Price” and then pick the comparison you want. Your drawn trendlines will be available in the drawing> Trendline section.
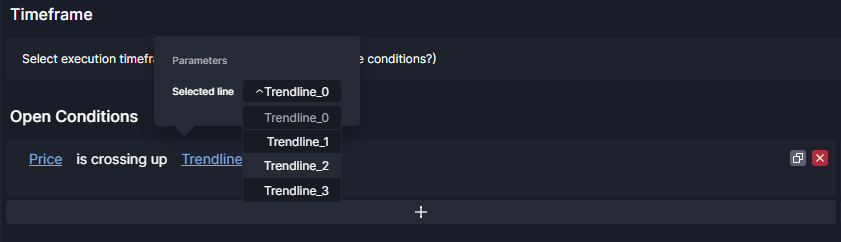
Using Trendlines as entry and exit conditions on cleo.finance
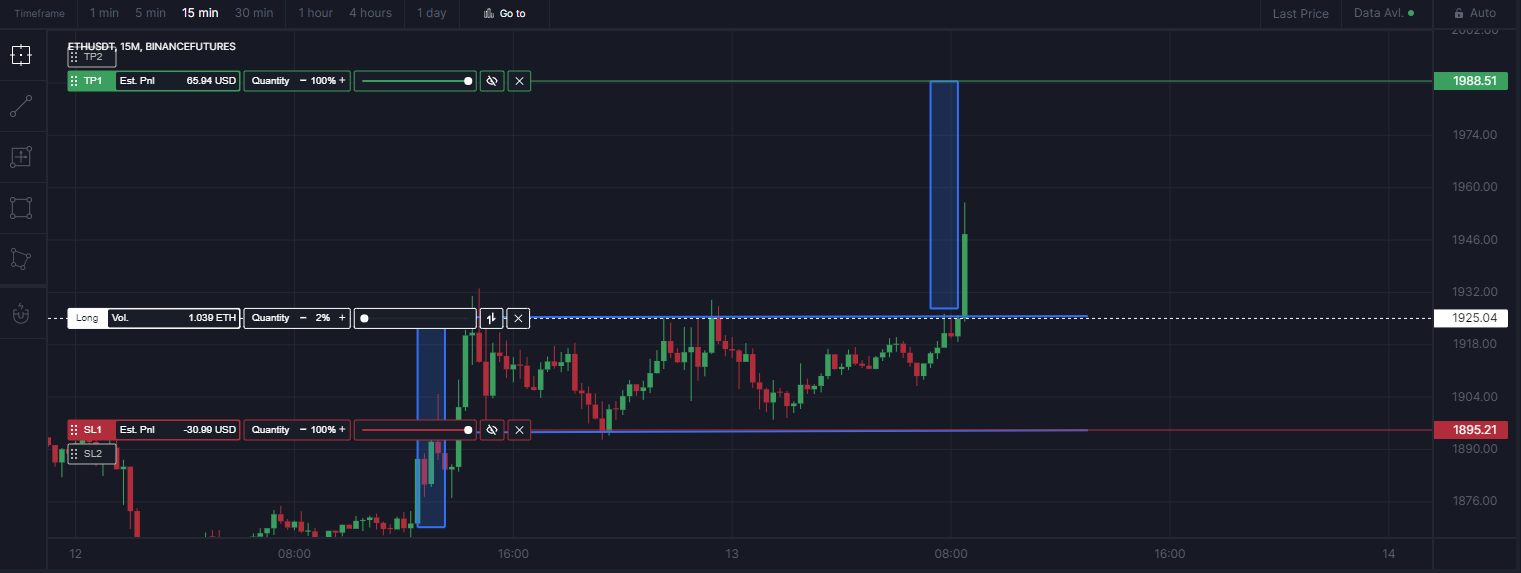
3. Set your volume and then you can place your stop just below the resistance line of the rectangle with around 1:2 RR (Risk to reward ratio). Set your target at the same height the price increase to the point where the pattern’s upper trendline ends.
4. All set and now you can hit the deploy live button.
Conclusion
The bullish rectangle pattern often forms in an uptrend market and it is characterized by two horizontal support and resistance lines. Although decreasing volume has no or little effect on the performance of the pattern, breakouts with significant volume tend to increase the performance. The more touches on the support and resistance lines, the stronger the bullish rectangle becomes. The general rule of thumb requires at least two touches for both trendlines to confirm the pattern.
Cleo.finance’s trendline trading tool helps traders save time while improving their strategies. By identifying chart patterns and drawing trendlines on the chart, traders can integrate them into their automated trading system for better outcomes. Traders have access to over 55 technical indicators that can be combined with the identified chart patterns to optimize their trades.