How to create a crypto bot trading RSI divergence8 min read
Divergence occurs when the direction of an asset’s price and the direction of a technical indicator move in opposite directions. Finding divergence between price and momentum indicators, such as the RSI and MACD, is a useful tool for identifying potential changes in the direction of an asset’s price and is therefore a cornerstone of many trading strategies. We are excited to announce that you can now use divergence to create open and close conditions for your trading strategies using cleo.finance!
Remember to backtest your findings – we found some interesting things when we investigated RSI trading on Bitcoin.
Table of Contents
Types of divergences
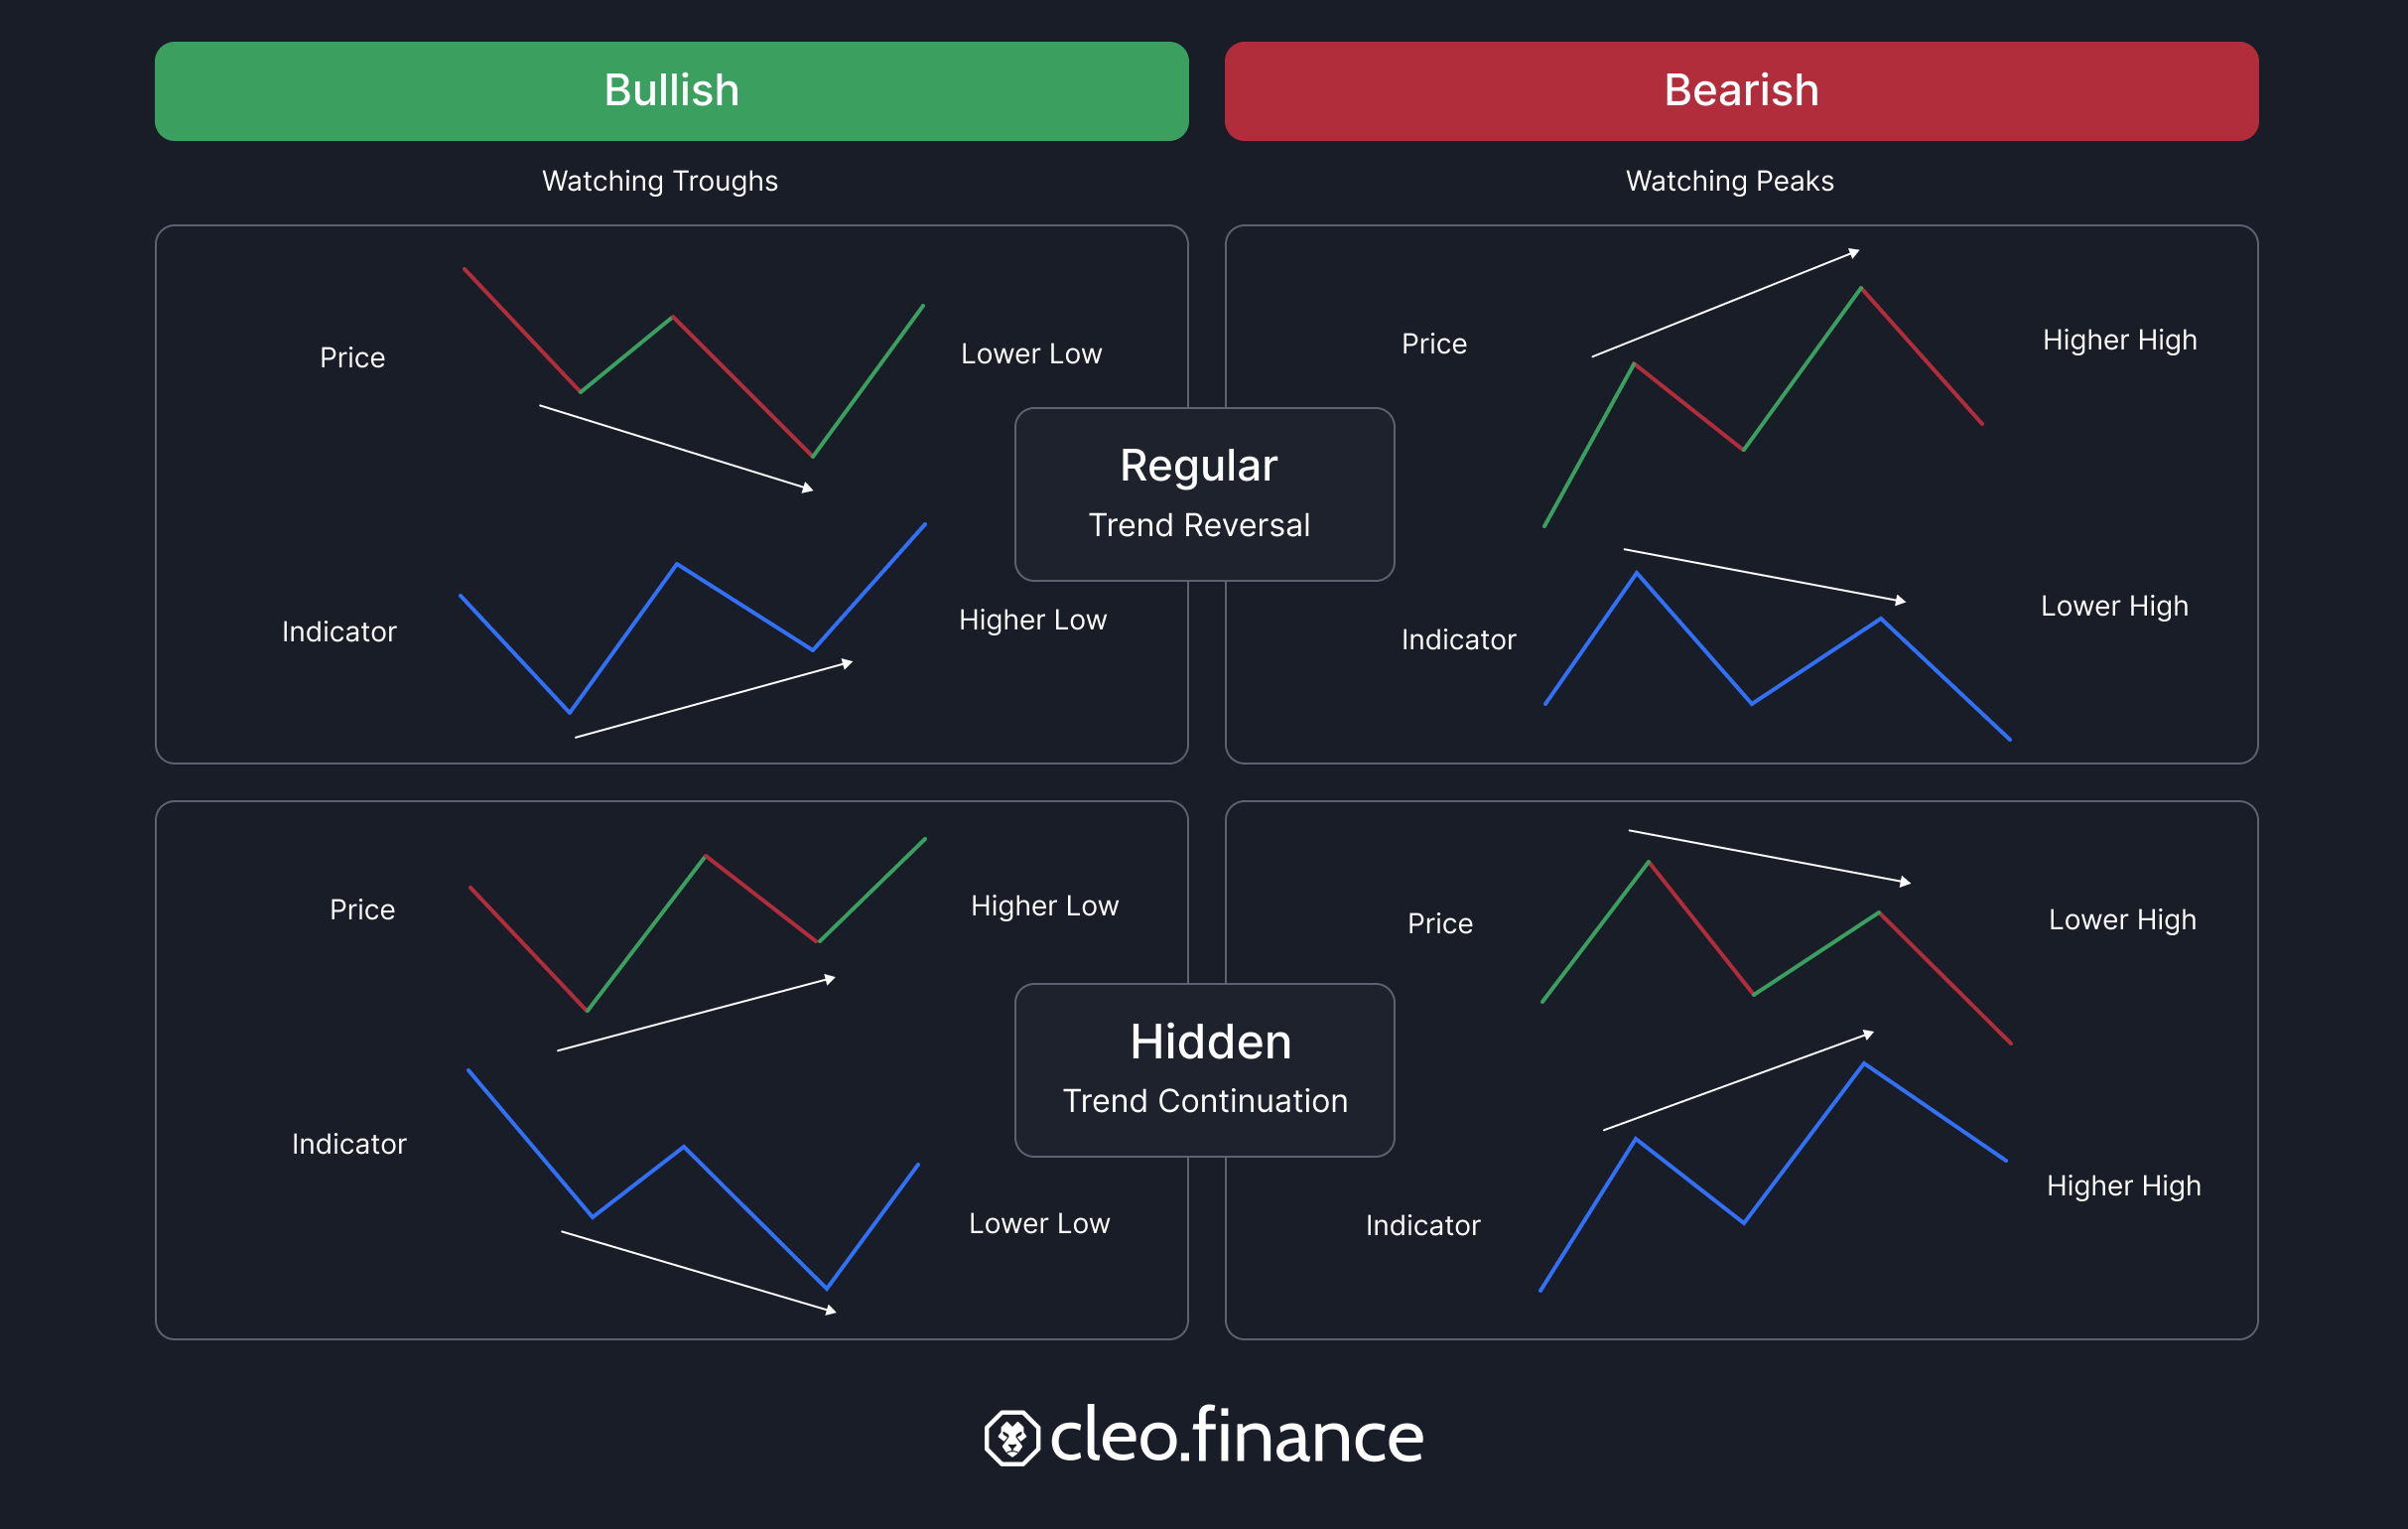
There are 4 major types of divergences:
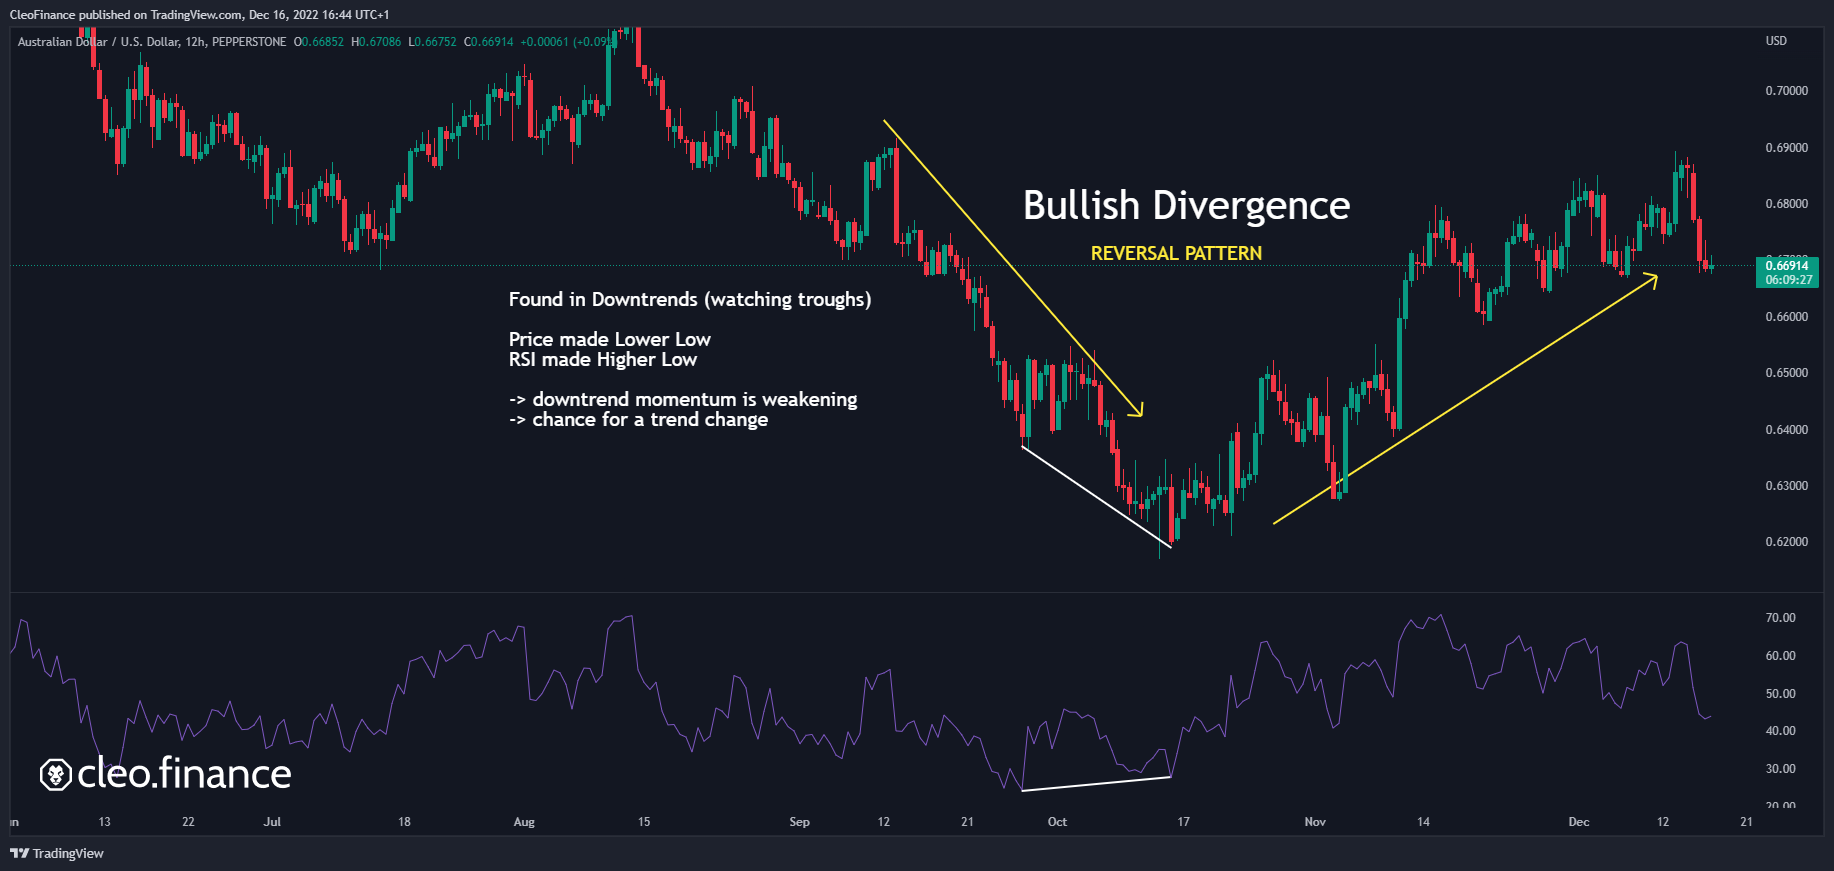
Bullish Divergence
Price is printing lower low while the technical indicator shows higher lows. This signalizes a weakening momentum of a downtrend and a reversal to the upside can be expected to follow.
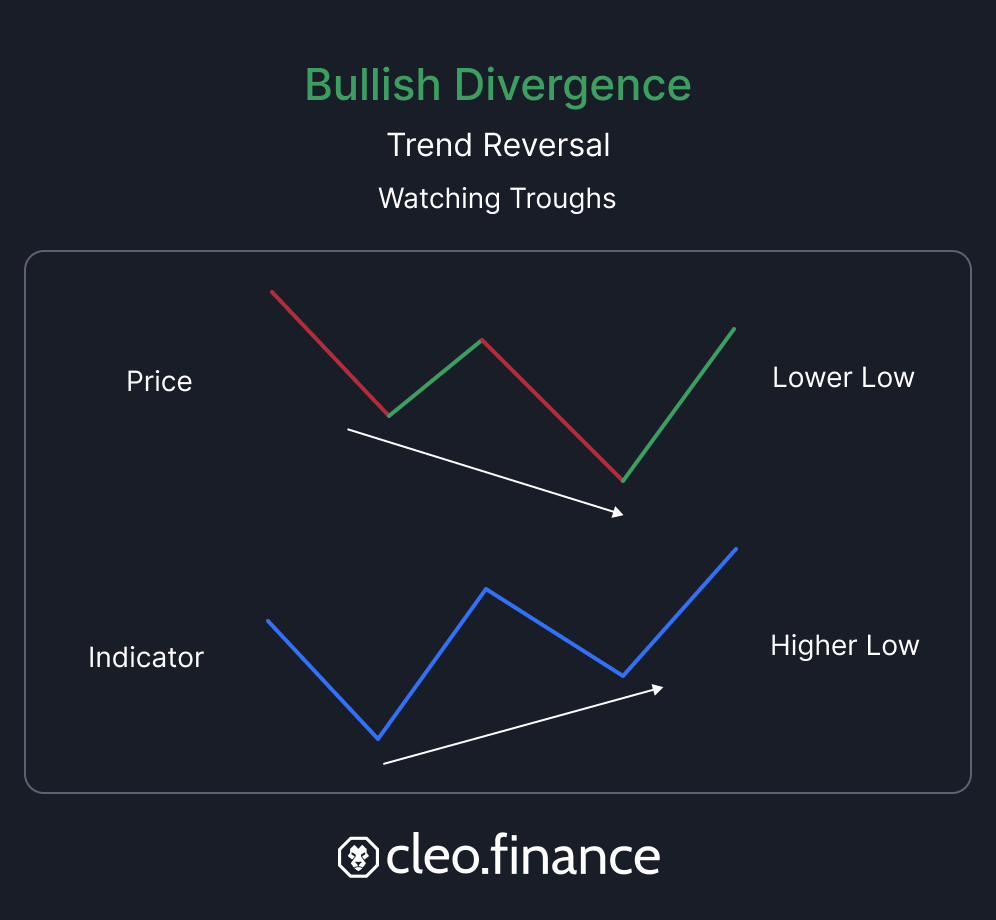
Quick Notes: watching troughs in a downtrend, the indicator moves up first
Hidden Bullish Divergence
Price is making higher lows while the oscillator makes lower lows. A hidden bullish divergence can signalize that uptrend will continue and can be found at the tail end of a price throwback (retracement down).
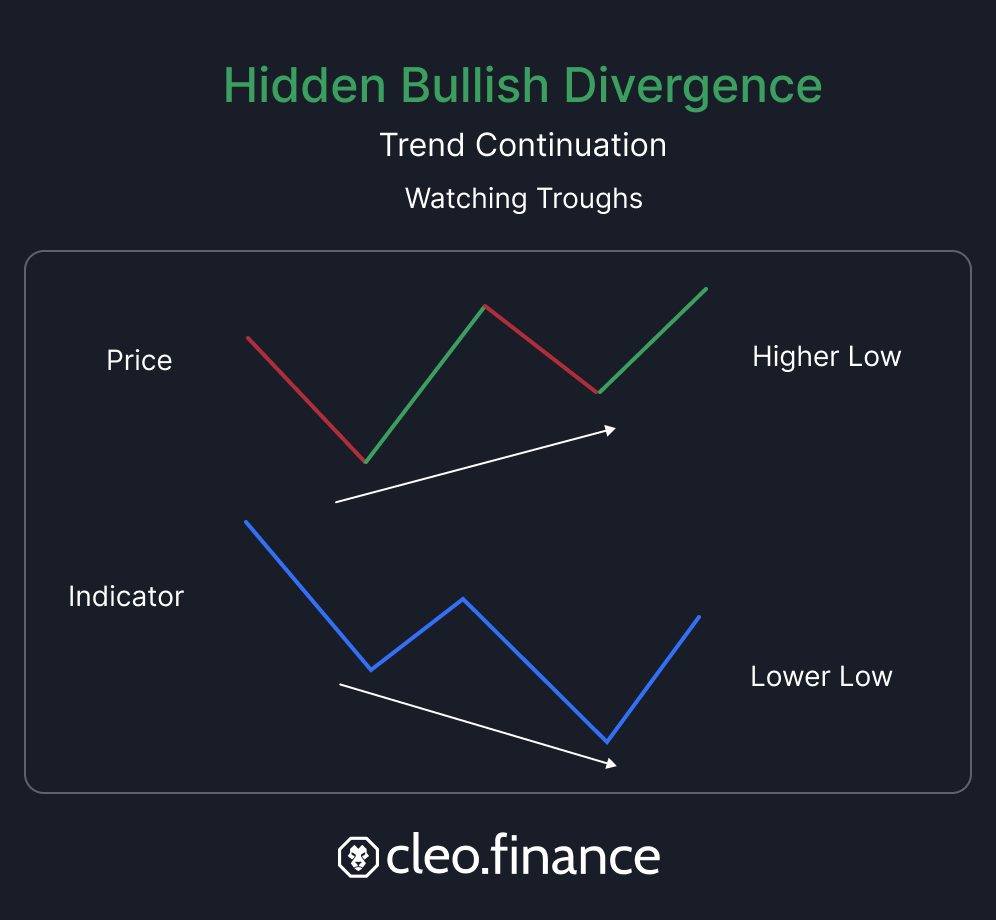
Quick Notes: watching troughs in an uptrend drawback, price moves up first
Bearish Divergence
Price is creating higher highs while the technical indicator shows lower highs. This signalizes that momentum to the upside is weakening and a reversal to the downside can be expected to follow.
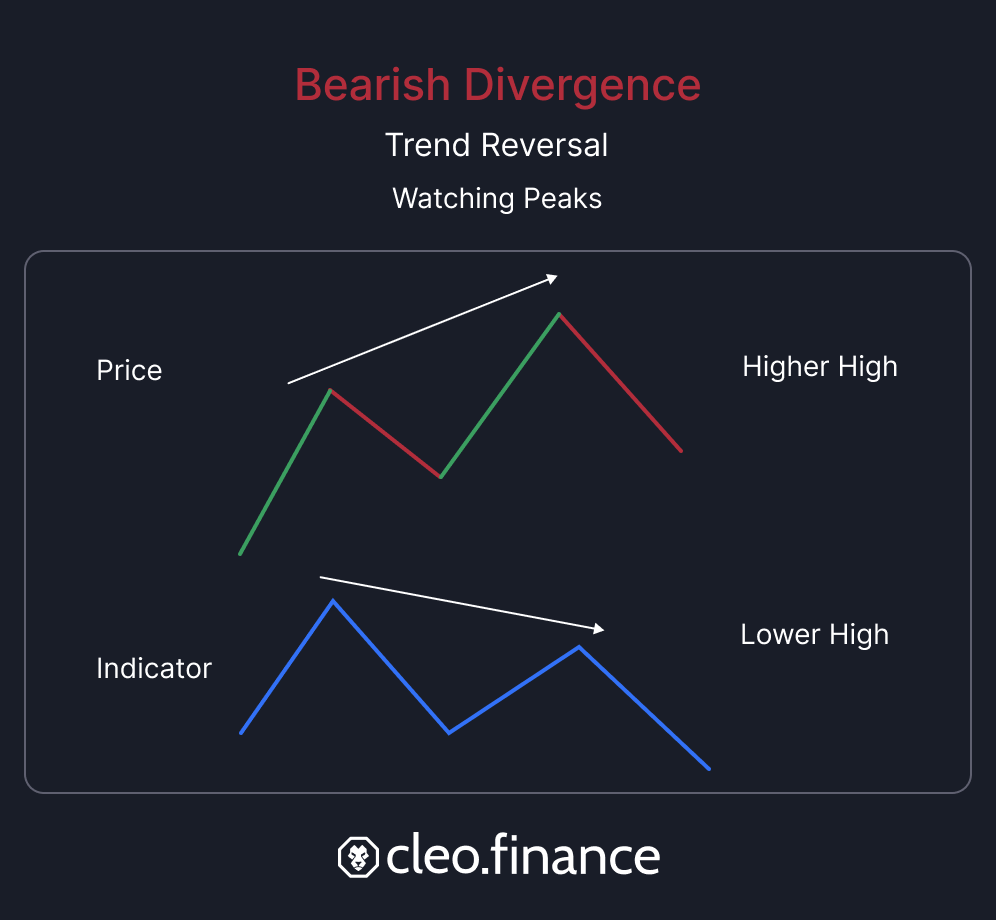
Quick Notes: watching peaks in an uptrend, the indicator moves down first
Hidden Bearish Divergence
Price is making lower highs while the oscillator makes higher highs. A hidden bearish divergence can signalize that downtrend will continue and can be found at the tail end of a price pullback (retracement up).
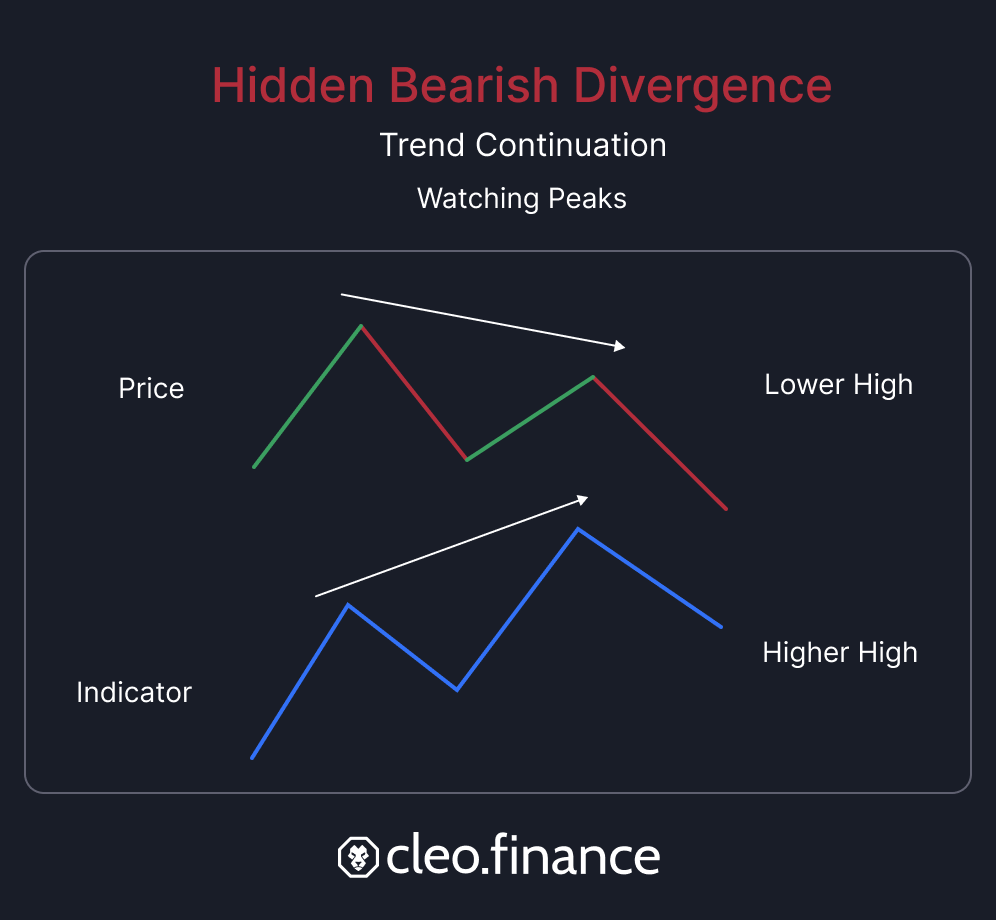
Quick Notes: watching peaks in a downtrend drawback, price moves down first
Regular divergences provide a reversal signal
Regular divergences can be powerful signals that a trend reversal is likely to occur. They indicate that the trend is strong but its momentum has weakened, providing an early warning of a potential change in direction. Regular divergences can be powerful entry triggers.
Hidden divergences signal trend continuation
On the other hand, hidden divergences are continuation signals that often occur in the middle of a trend. They indicate that the current trend is likely to continue after a pullback, and can be powerful entry triggers when confluence is present. Hidden divergences are typically used by traders to join the existing trend after a pullback.
Validity of the divergence
The typical use of divergence is with a momentum indicator – such as RSI, Awesome oscillator, or MACD. These indicators focus on current momentum, and therefore trying to map out divergence from 100+ candles ago does not have any predictive value. However, changing the indicator’s period influences the look-back range for a valid divergence. Always use discretion when determining the validity of the divergence.
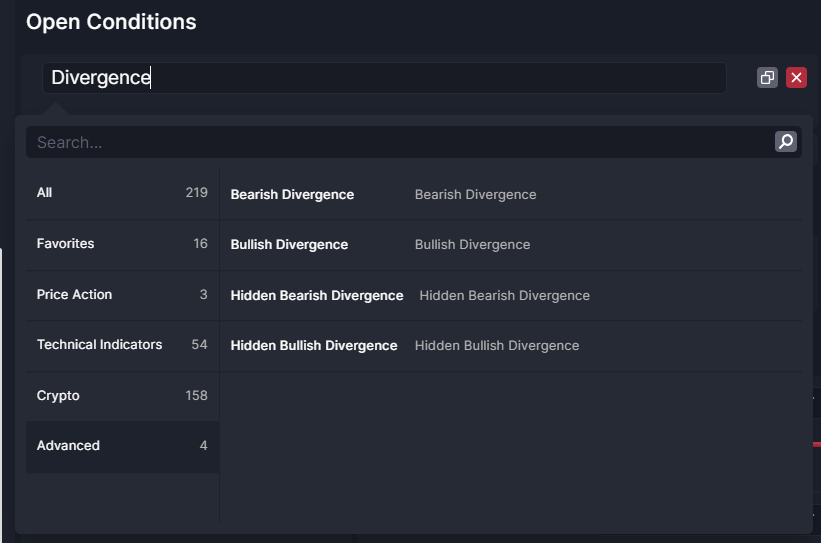
Available Divergences in cleo.finance:
- Bullish Divergence
- Bearish Divergence
- Hidden Bullish Divergence
- Hidden Bearish Divergence
and you can compare those divergences between two points:
- Price with an oscillator indicator
- An oscillator indicator with another oscillator indicator
- Price of any asset with the price of any other asset.

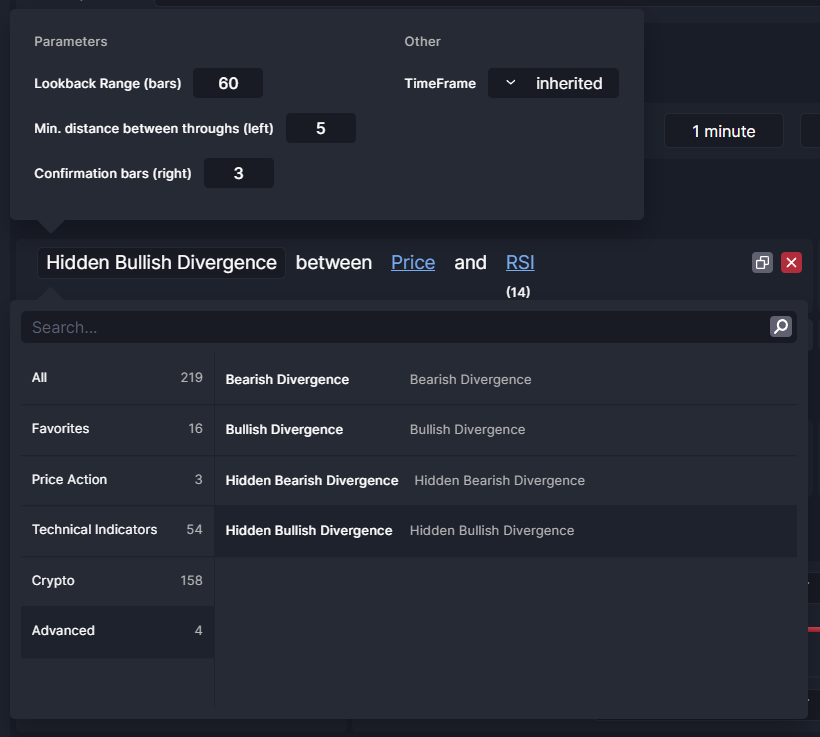
Customizable parameters
All divergences have four editable parameters that traders can further customize their divergence strategies to the best:
Lookback range (period)
This parameter sets how far back should the strategy search for the divergence. The default value is 60 which means “Look for the divergence anywhere within the last 60 bars”
Min. distance between peaks/troughs (Pivot Lookback Left)
This parameter defines how many candles on the left side are needed to confirm that the pivot point is found
Confirmation bars (Pivot Lookback Right)
This parameter defines how many bars on the right side are needed to confirm that the pivot point is found
Timeframe
Here you can define the timeframe on which the divergence should occur. This timeframe can be different from the execution timeframe of the strategy.
The two pivot point settings define each peak/trough in the divergence.
If you keep the default settings of a bullish divergence:
- Lookback Range (bars): 60
- Min. distance between troughs (left) = 1
- Confirmation bars (right) = 3
This setting means that both troughs in the divergence must be the lowest points within the nearest 5 bars (lower than 1 bar to the left and three bars to the right). This must be true for both troughs that can be found within the last 60 candles (lookback range). The divergence will be confirmed 3 bars after the nearest pivot point was found.
The most frequent uses are with RSI divergence and MACD divergence, but rest assured any other oscillator can be tested and live traded using the trading automation platform cleo.finance.
Conclusion
Divergences can be an important tool for traders to add to their arsenal, but they should be used in a careful and strategic manner. By keeping these things in mind, traders can potentially use divergences to their advantage in making more informed trading decisions.
It is important to approach divergences with a disciplined and strategic mindset. Using them in conjunction with other forms of technical and fundamental analysis – such as Support and Resistance lines, Fib retracements, or Smart Money Concepts only increases conviction of the divergence validity. Read our Risk Management guides on position sizing and stop loss placement. You can start creating your optimal divergence trading strategies instantly along with over 55 technical indicators, price action, and candle sticks data points! We are constantly improving the cleo.finance platform. If you have a request for an indicator or data point, let us know.
Sign up or login to cleo.finance now and reach your full trading potential with the most innovative tools in the markets!