

Is RSI a good indicator for trading Bitcoin, or a meme? The answer is in the backtesting8 min read
Traders tend to have a strong opinion if RSI holds any value or not. With Bitcoin’s recent reduction in price the discussion is getting heated. The one thing that’s missing is backtesting. There’s no reason for anyone to guess if RSI is worth it, when a simple backtest will give you the answer in minutes.
Two trading ranges were used. The first backtest happening on 1 year and the second on 5 years.
We backtested RSI on Bitcoin and this is what we found
There are many variables that make a trading strategy. For this experiment we just ran the basic setup:
When Bitcoin is below 30 buy
When Bitcoin is above 70 sell
No stop losses or take profits, we are trading based on one indicator only. The backtests do include trading fees and they are on spot only so no leverage.
The first backtest was first done on the past year so 23.06.2023 – 23.06.2024.
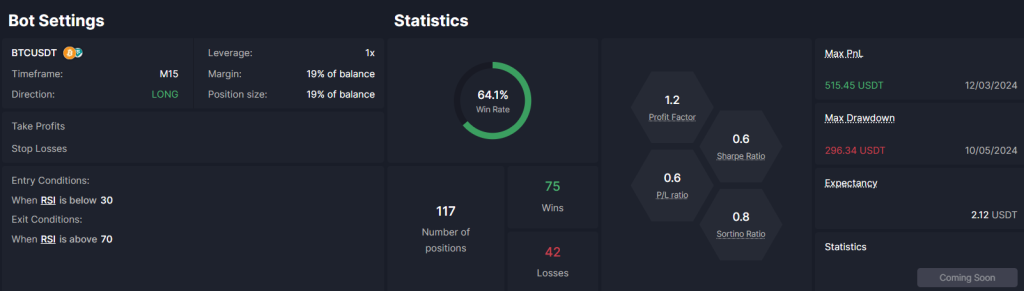
Trading Bitcoin with RSI on the 15 min timeframe in the past year
If you spent the last year trading Bitcoin using only this conventional RSI setup on the 15 min, you would be sitting on a tiny 2,5% gain. Just buying Bitcoin and holding it would blow this out of the water.
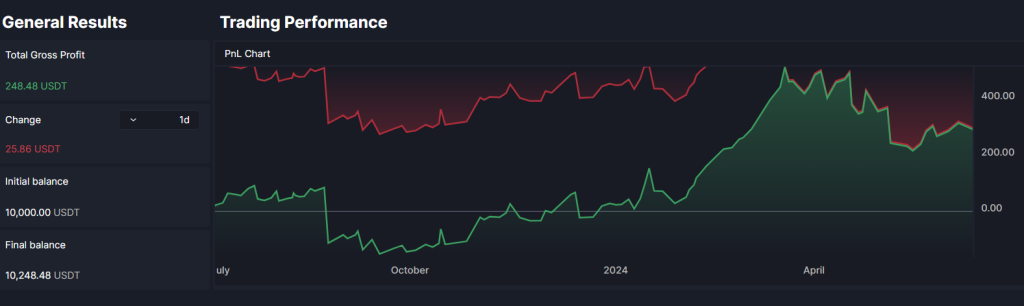
It would have you enter and exit 115 positions, winning a bit more than 64%. So while this trading strategy is far from sufficient, it does demonstrate that winning is not everything in trading.
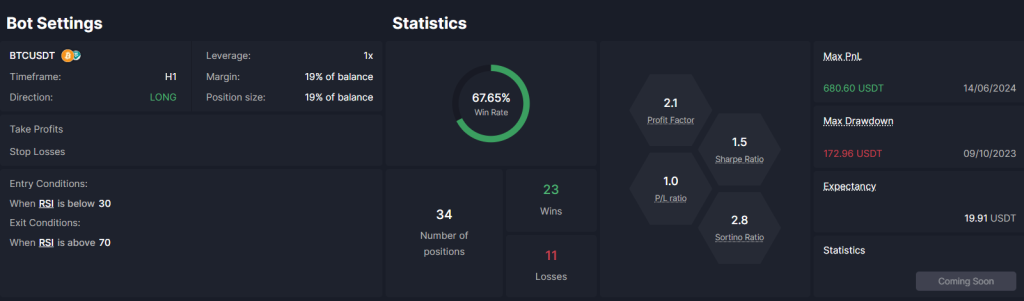
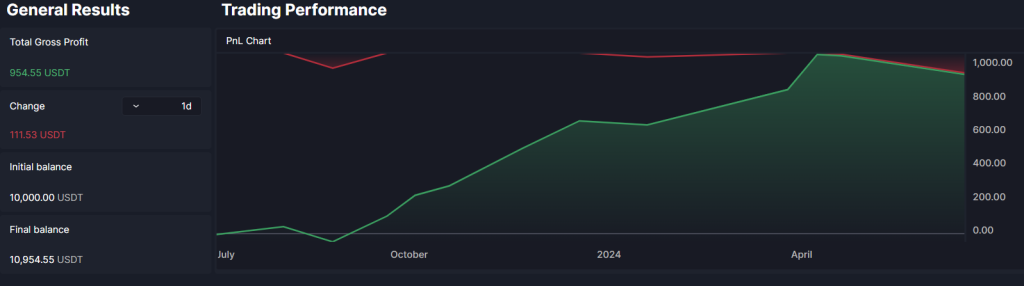
Trading Bitcoin with RSI on the 1 hour timeframe in the past year
What about when we go slightly higher on the charts? Well, you’d be sitting only at 6,4% gain, showing that on its own RSI was not the right choice.
There would be 34 positions and you’d win 23 of them, but when you lose it would be big. We’re noticing that despite the tiny profit, there might be an opportunity here.
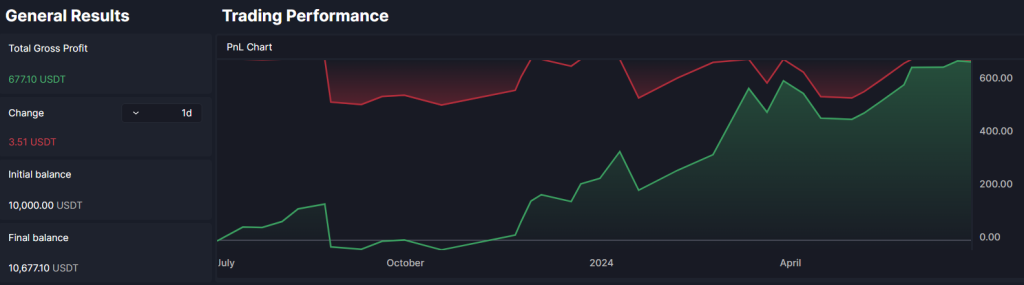
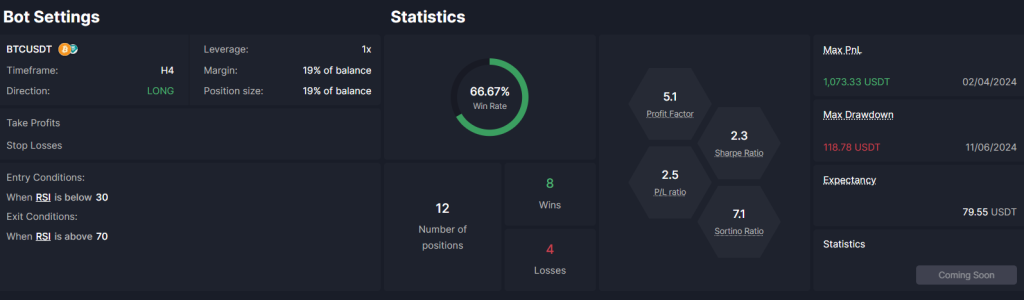
Trading Bitcoin with RSI on the 4 hour timeframe in the past year
The 4 hour is one of the favored timeframes and it appears it does hold a tiny improvement, at least in regard to the results of this strategy. Your profit would be 9,5%, far from why people bother trading crypto.
Please note that we have only 12 positions, so the sample size is lacking. However again, the win rate is excellent with 8 winning positions.
Trading Bitcoin with RSI on the daily timeframe in the past year
With this RSI trading strategy you would only see 1 position in the past year. A profitable one, but bringing you only 2,1%.
One position is too little to galvanize anything, but notice how much higher than 70 RSI went after blasting through it and the same happened with price.
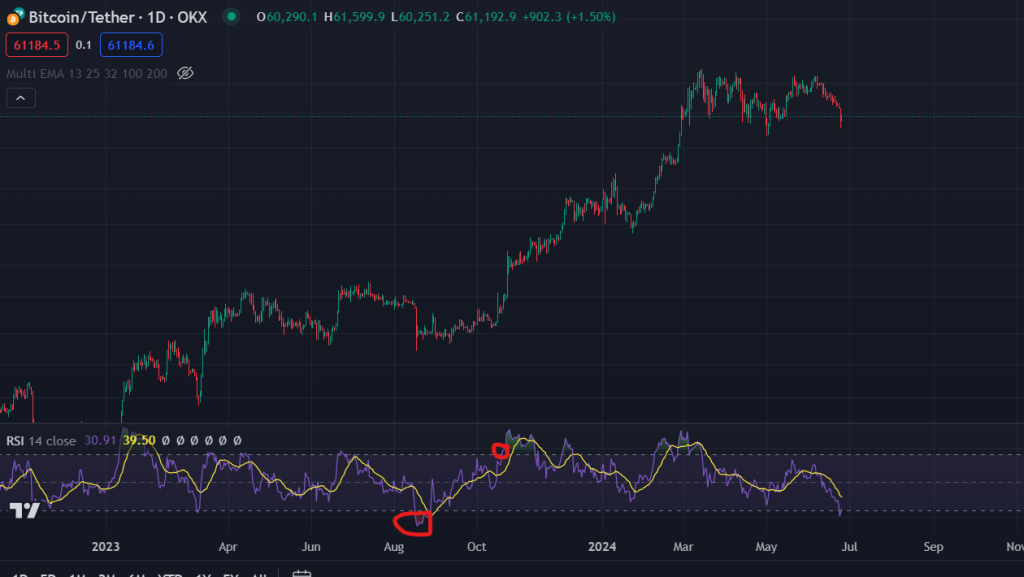
It would be wise to investigate the charts and do further backtesting to see if we are being to conservative with the 30 and 70 RSI values when it comes to Bitcoin.
This second backtest was done on the past 5 years
Let’s see how the RSI backtesting results look with even more data: 2019 – 2024
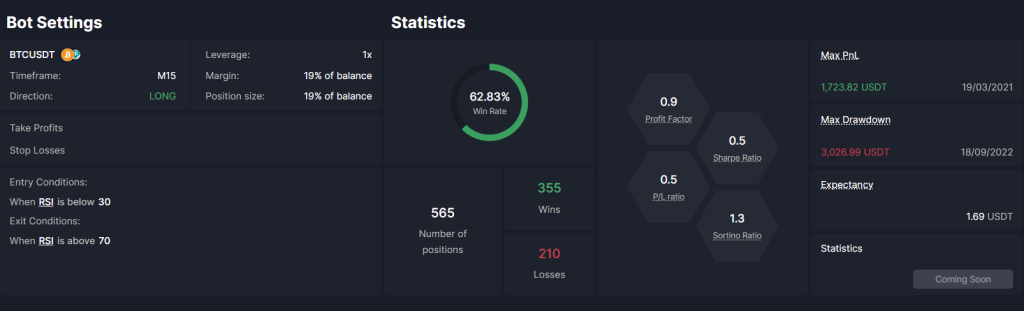
Trading Bitcoin with RSI on the 15 min timeframe in the past 5 years
Given the results from the 1 year backtest you should not be expecting a stellar performance. This strategy is a loser for the past 5 years and would have you see a loss of -9,5%. Pretty terrible considering what the holding returns are for the same period.
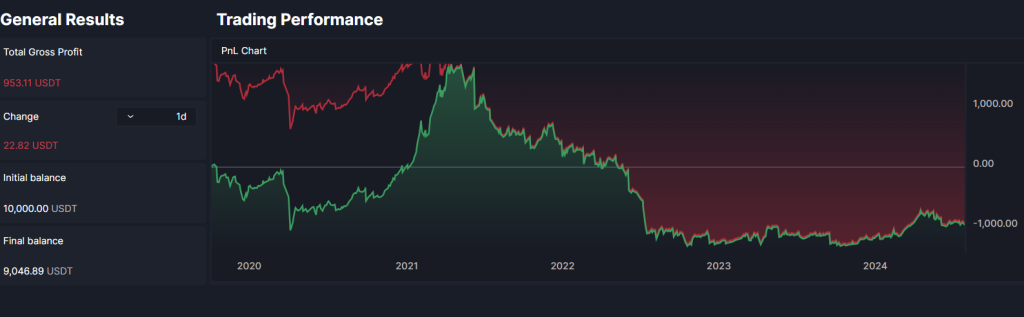
565 positions for a 63% win rate. Again, something is working in this strategy, but it’s simply a dud on its own.
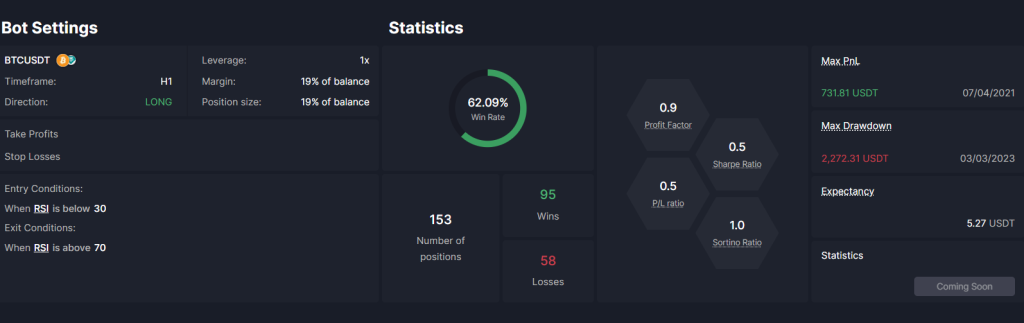
Trading Bitcoin with RSI on the 1 hour timeframe in the past 5 years
You would be right in expecting consistency with the results of the previous 1 year backtest. Using only RSI you’d be sitting on a -8% loss. With leverage this can be infinitely amplified.
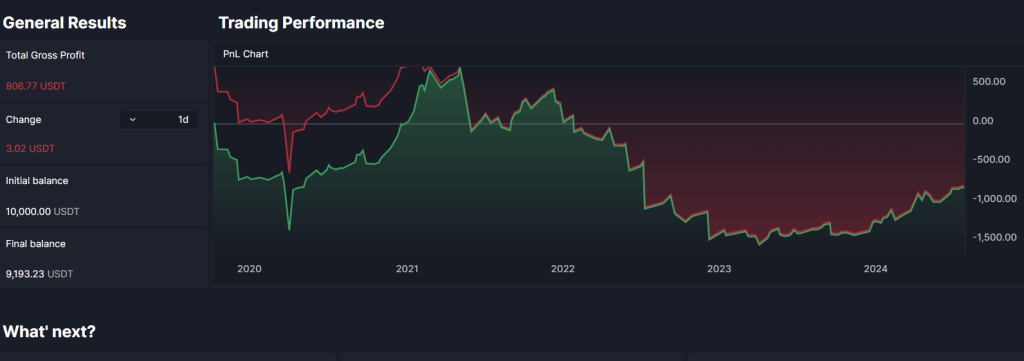
You’d see 153 positions and win 62%, but just look at the size of that drawdown.
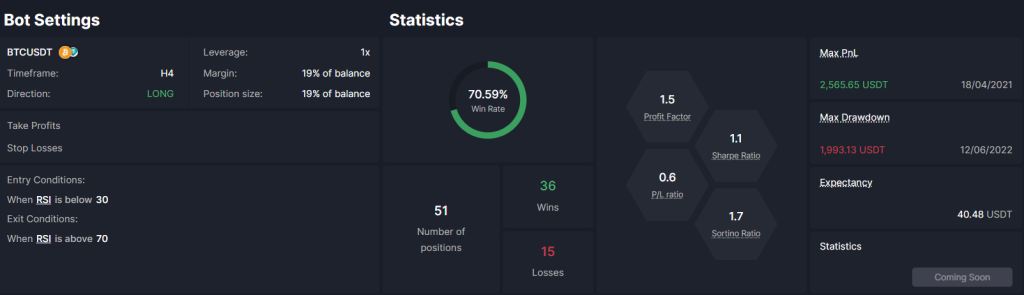
Trading Bitcoin with RSI on the 4 hour timeframe in the past 5 years
We can see why traders might be more optimistic about this 4 hour timeframe and RSI. If you traded this strategy for 5 years you would have 22,5% gain. Abysmal for crypto trading but still the only positive performance compared to the other timeframes.
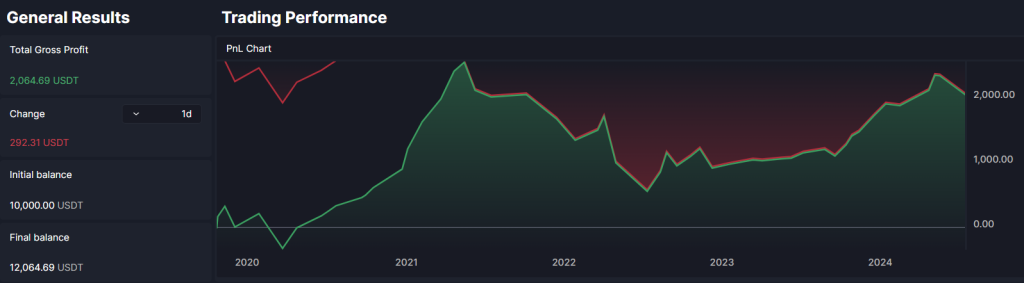
Moreover the win rate is at an incredible 70%. This is a reason to dig deeper.
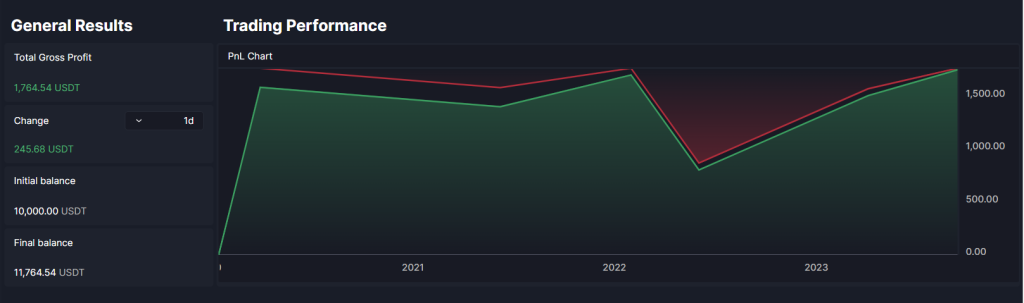
Trading Bitcoin with RSI on the 1 day timeframe in the 5 years
There would be only a handful of positions if you traded Bitcoin for 5 years using only RSI and you’d be sitting at 17,6%. Those 6 positions are still not enough for a conclusion on this timeframe.
Then how to use RSI productively?
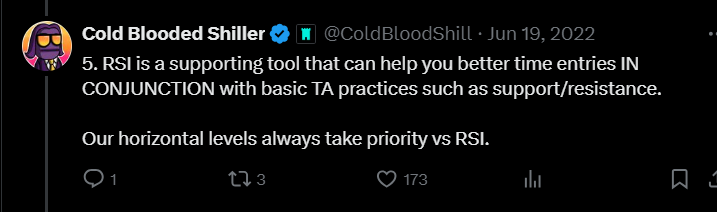
For one excellent example we turn to this writeup by Cold Blooded Shiller. In his view the 70/30 levels are bogus as we saw in the results here, but the most productive level for judging momentum is the 50 on high time frames.
In this method RSI is just part of the puzzle with horizontal levels taking priority. The thread sheds some light on divergencies as well and is well worth a read and a save.
Would be interesting to see some backtesting results on this. If you need a bit more discretionary space try the Manual Backtester.
Conclusion: Is RSI a good indicator for trading Bitcoin, or is it a meme?
The profit using only RSI is tiny or even negative no matter how much data is thrown at this backtest. However, there are consistently high win rates across timeframes that could be an indication of some potential in this indicator when used on Bitcoin.
For further research the used values of the indicator should be for consideration. Also take profit/stop loss levels could be of use. You could construct a backtest using lines on the chart in cleo.finance.
One thing is clear, on its own when it comes to trading Bitcoin RSI is a meme and now you know.
Try testing it yourself, make changes, add indicators, candlesticks, horizontal lines, multiple TPs or SLs in cleo.finance.