

10 Free Trading Strategies for crypto, forex & stocks – templates13 min read
We post results every Friday for these trading strategies on @cleofinance.
Everybody needs a trading strategy to start with. We’ll do you one better: you can backtest all of these in minutes.
The way to achieve long-term profitability is through putting a bit of work upfront, understanding the markets, and honing your trading plan accordingly. Nevertheless, most traders tend to avoid constructing a trading strategy until the market turns on them.
Trading setups – aka picking the spot where you enter and exit the market – tend to get all the focus online, while proper risk management is overlooked and understudied. Make sure you understand Position Sizing and Stop Loss placement, which we covered in the first two articles of the Risk Management series on this blog before reading on.
In this article, we review the trading templates available for free in cleo.finance. Each of these templates is meant to be a starting point in your trading journey and together are the most used basic setups involving technical indicators.
Table of Contents
10 templates for developing your trading strategy
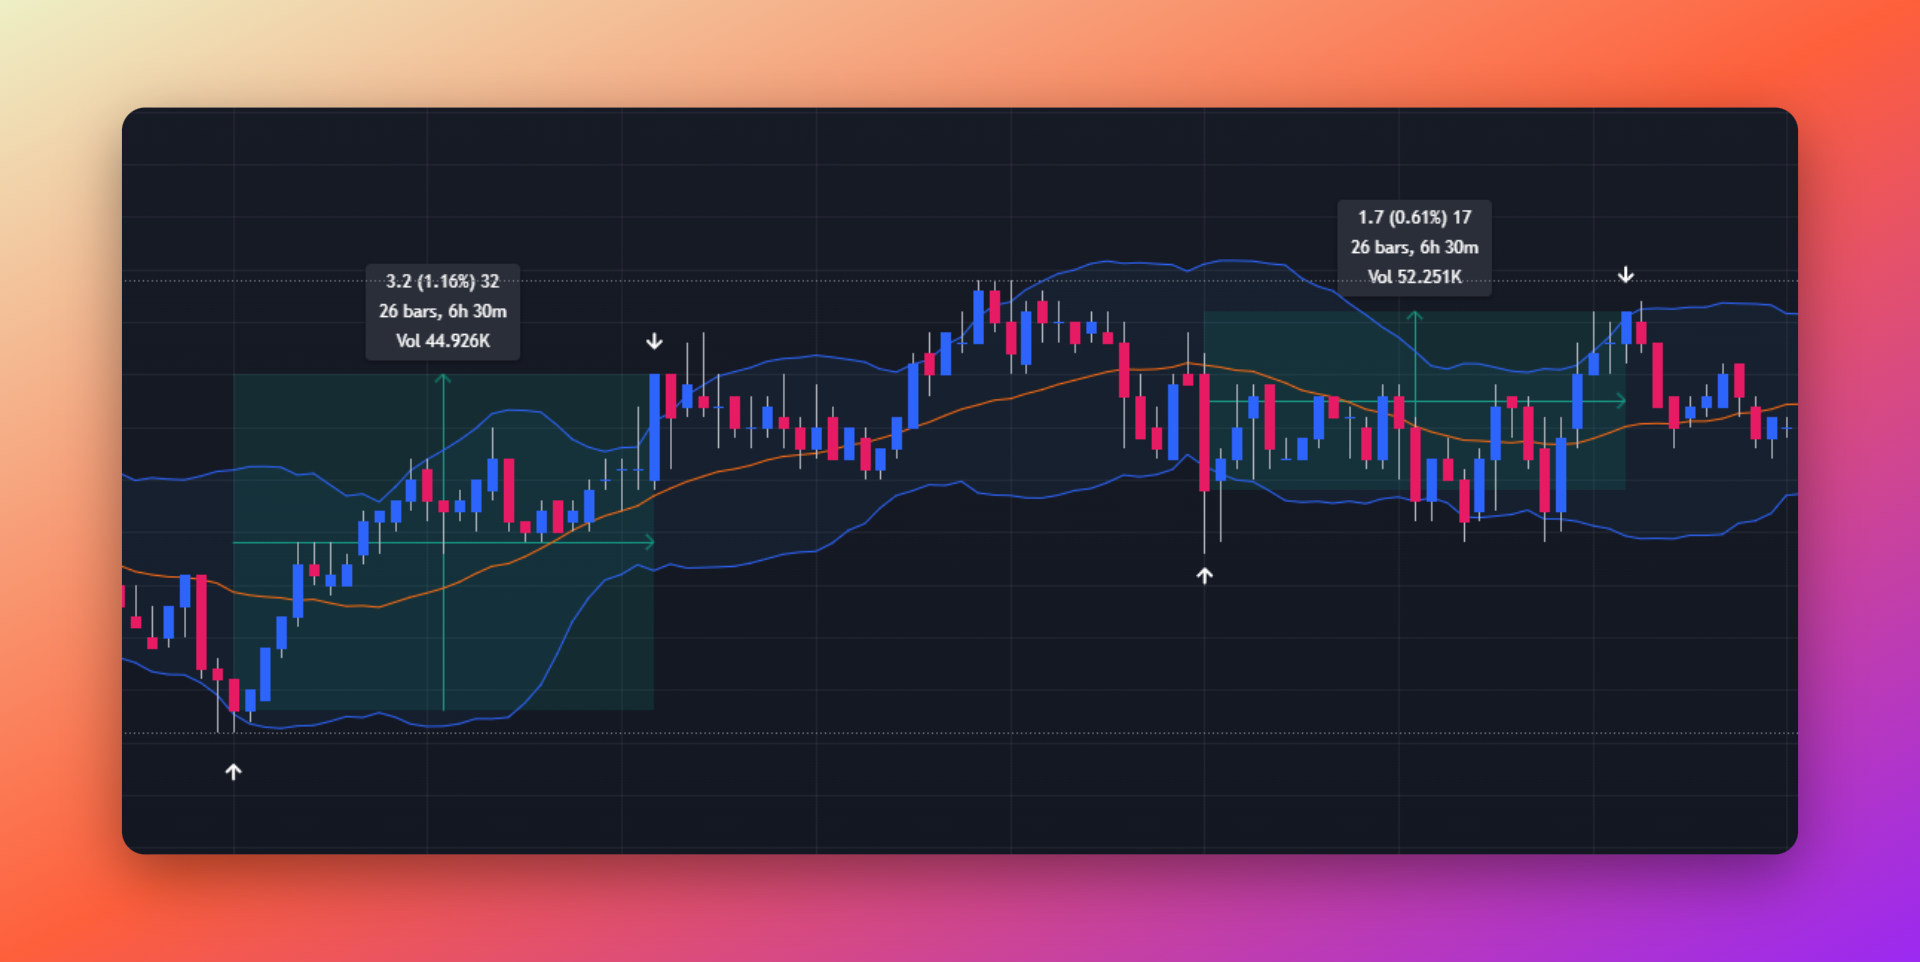
1. Lower Bollinger Band® cross – LONG trading strategy
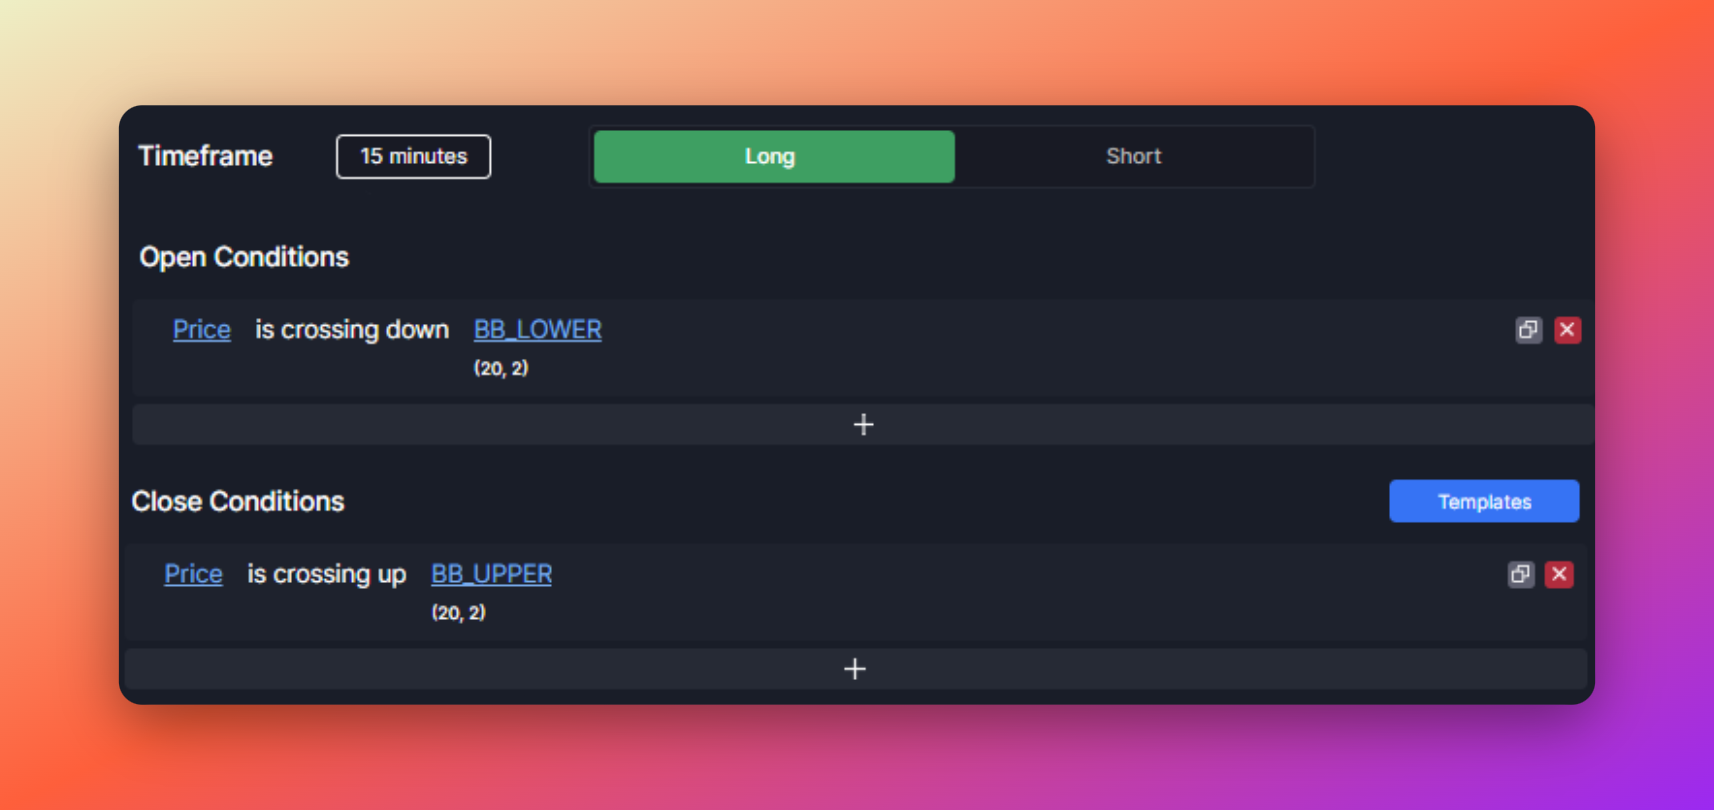
This setup opens a long (buy) position when the price closes below the lower band of the Bollinger Band® and exits when the price closes above the upper band. Bollinger Bands® is set at 2 standard deviations from the 20-day SMA.
This setup does not work well in trending markets, but profits in ranging markets. Therefore, you should implement a trend filter before you consider using this template. For higher hit rate substitute the exit conditions of an Upper Bollinger band® cross for SMA(20) – the middle line.
You can change the deviation, the SMA settings, the timeframe, or add/edit any other condition to this template – as with all the templates in cleo.finance.
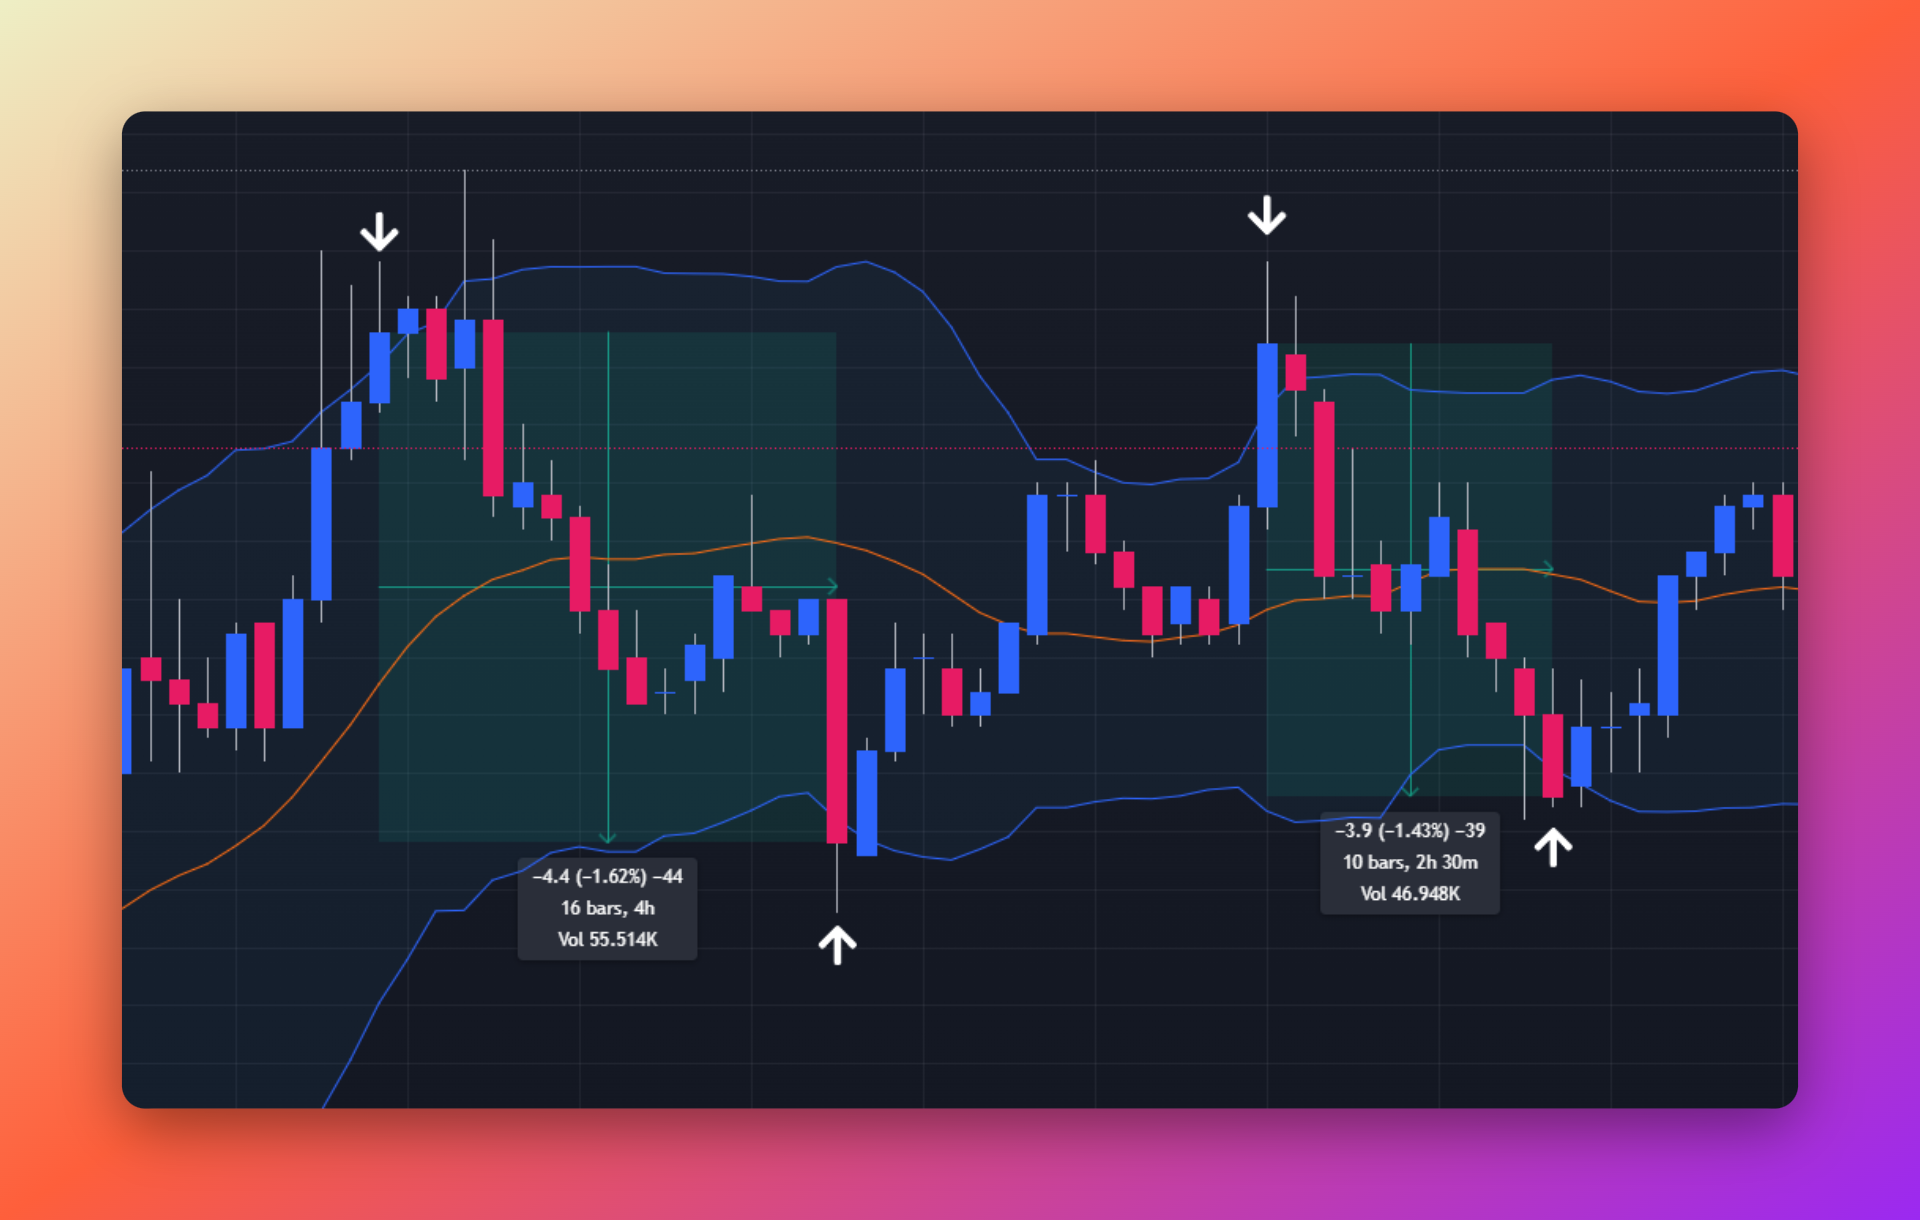
2. Upper Bollinger Band® cross – SHORT trading strategy
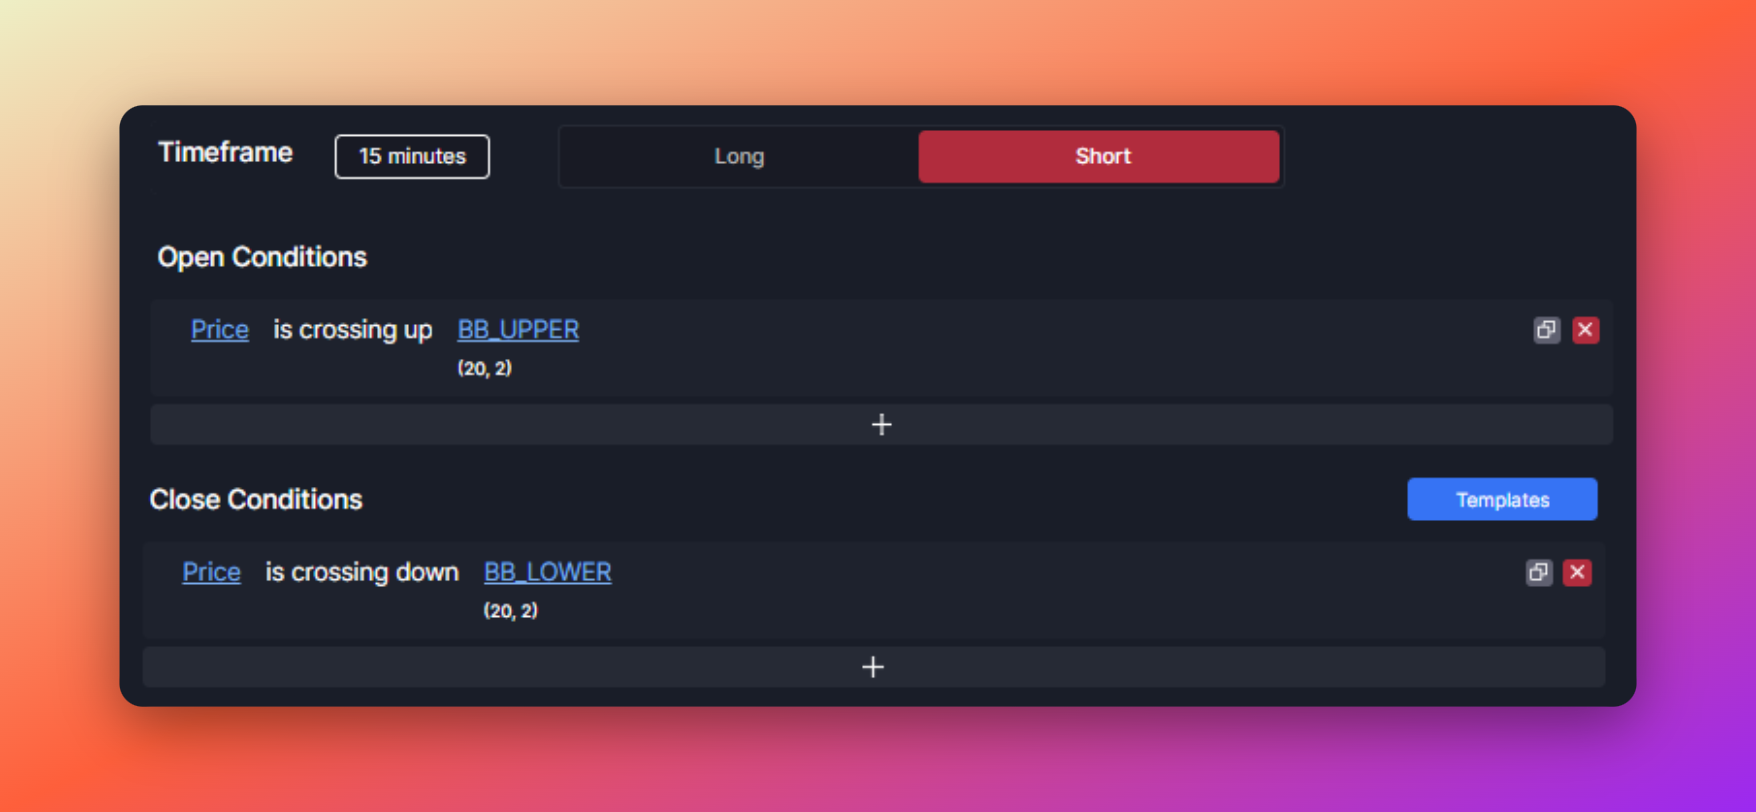
This setup is the reversed setup of previous Long template. It opens a short (sell) position when the price closes above the upper band of the Bollinger Band® and exits when the price closes below the lower band. Bollinger Bands® is set at 2 standard deviations from the 20-day SMA.
Just like the previous setup, this also does not work well in trending markets, but profits in ranging markets.
You can change the deviation, the SMA settings, the timeframe, or add/edit any other condition to this template.
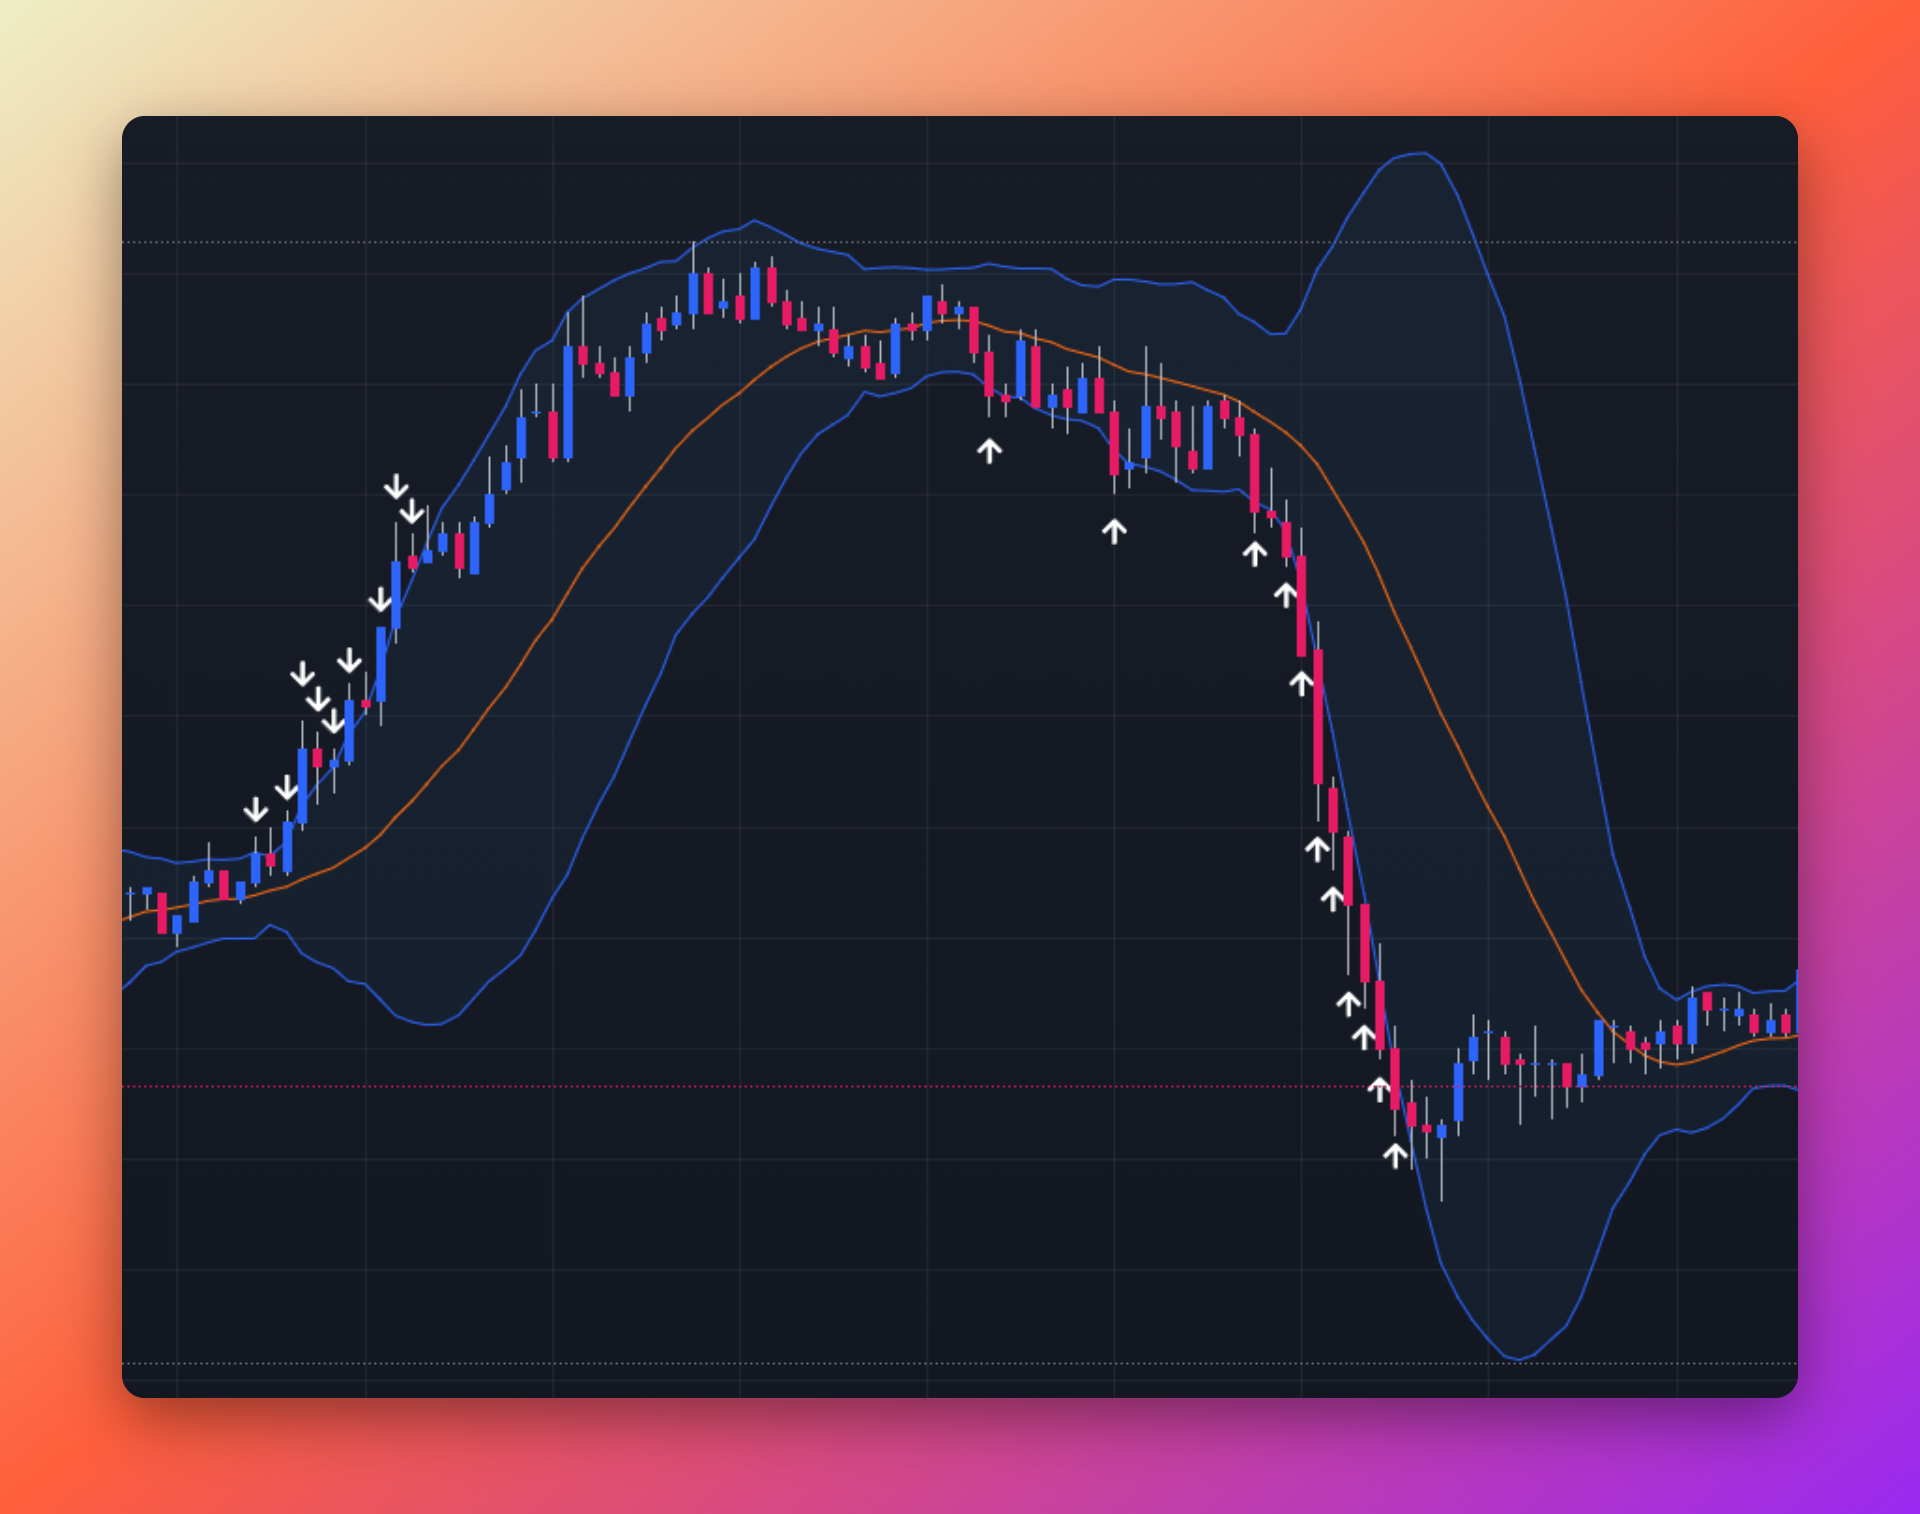
3. Uptrend with EMA, PSAR, MACD – LONG trading strategy
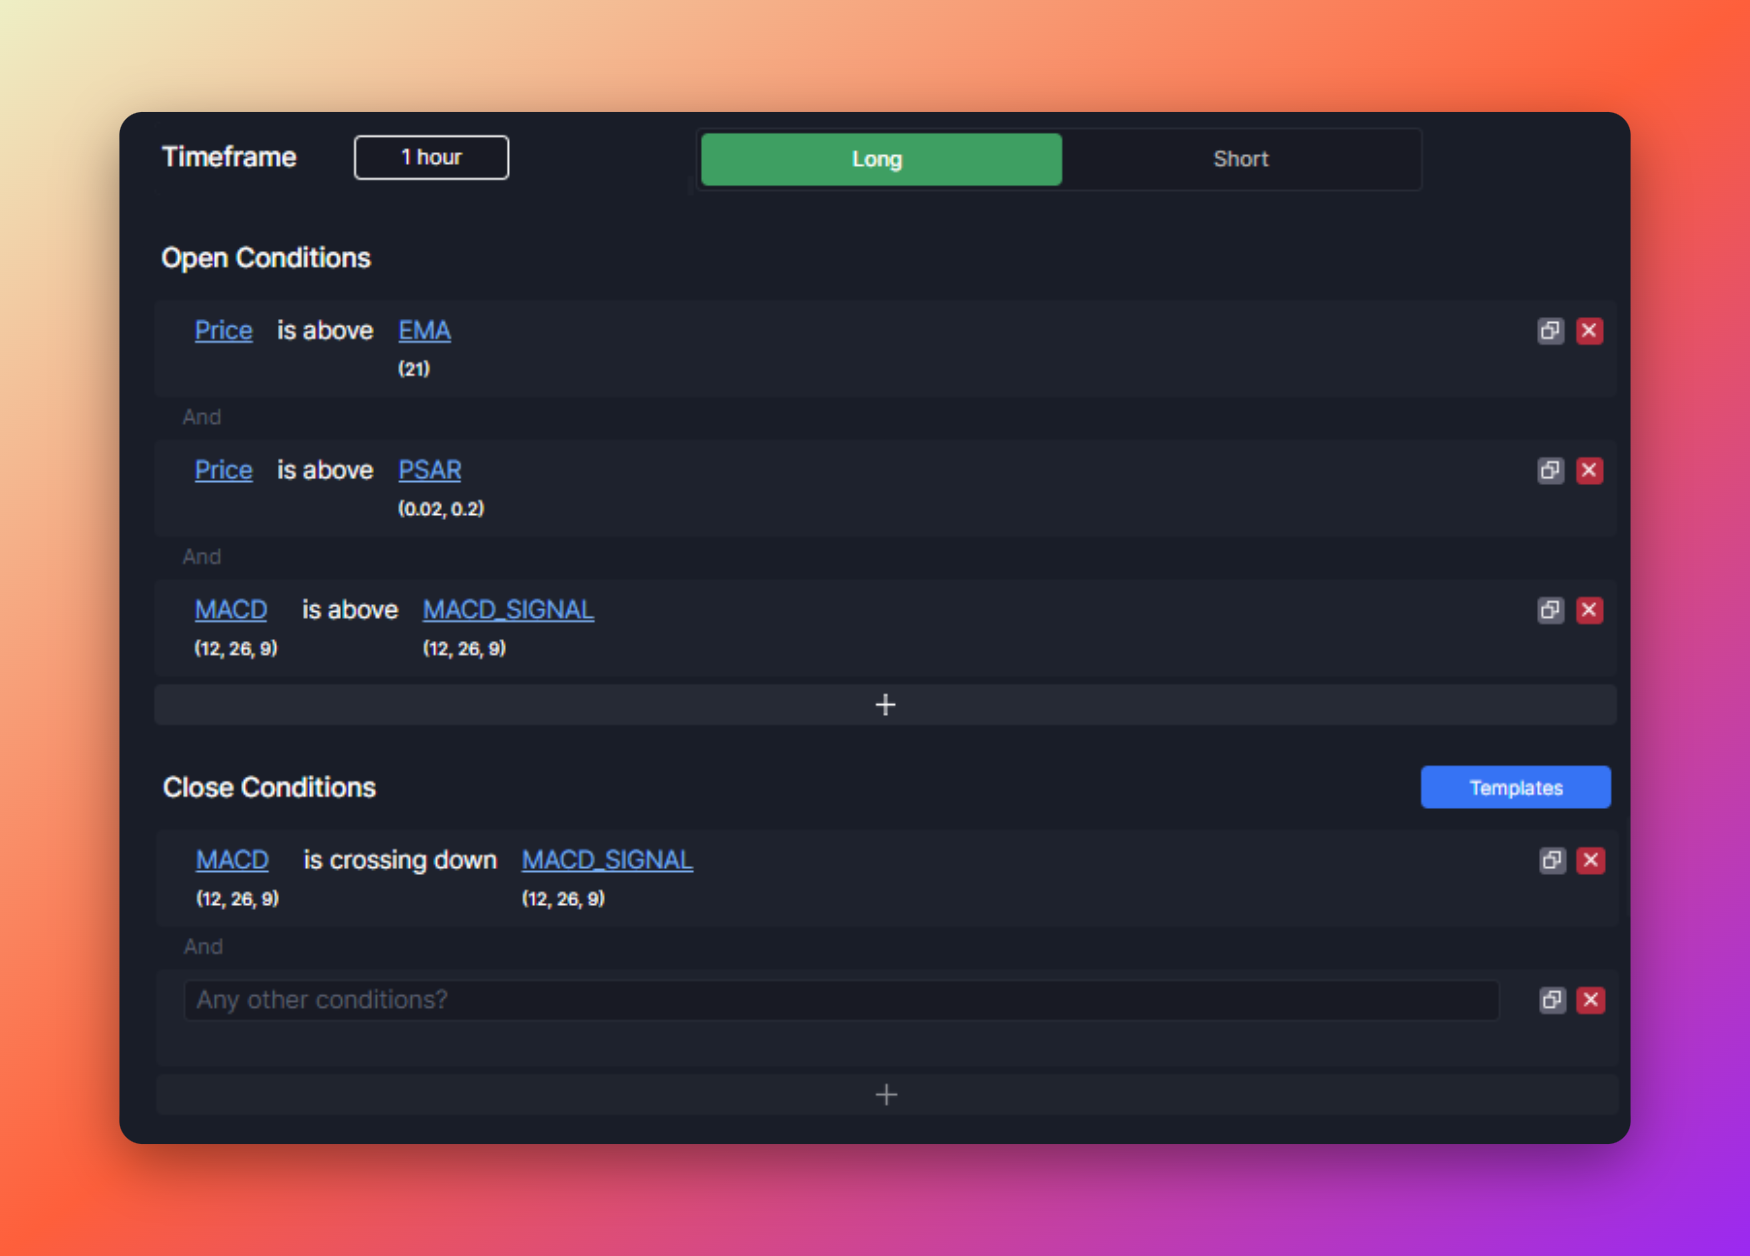
This setup opens a long (buy) position when the price is above EMA(21), Parabolic SAR, and when the MACD line is above the Signal line all on a 1-hour timeframe. Parabolic SAR and MACD indicators both have default settings.
This setup tends to profit in uptrending market conditions and should be avoided in ranging markets. You can change the timeframe to fit your preferences.
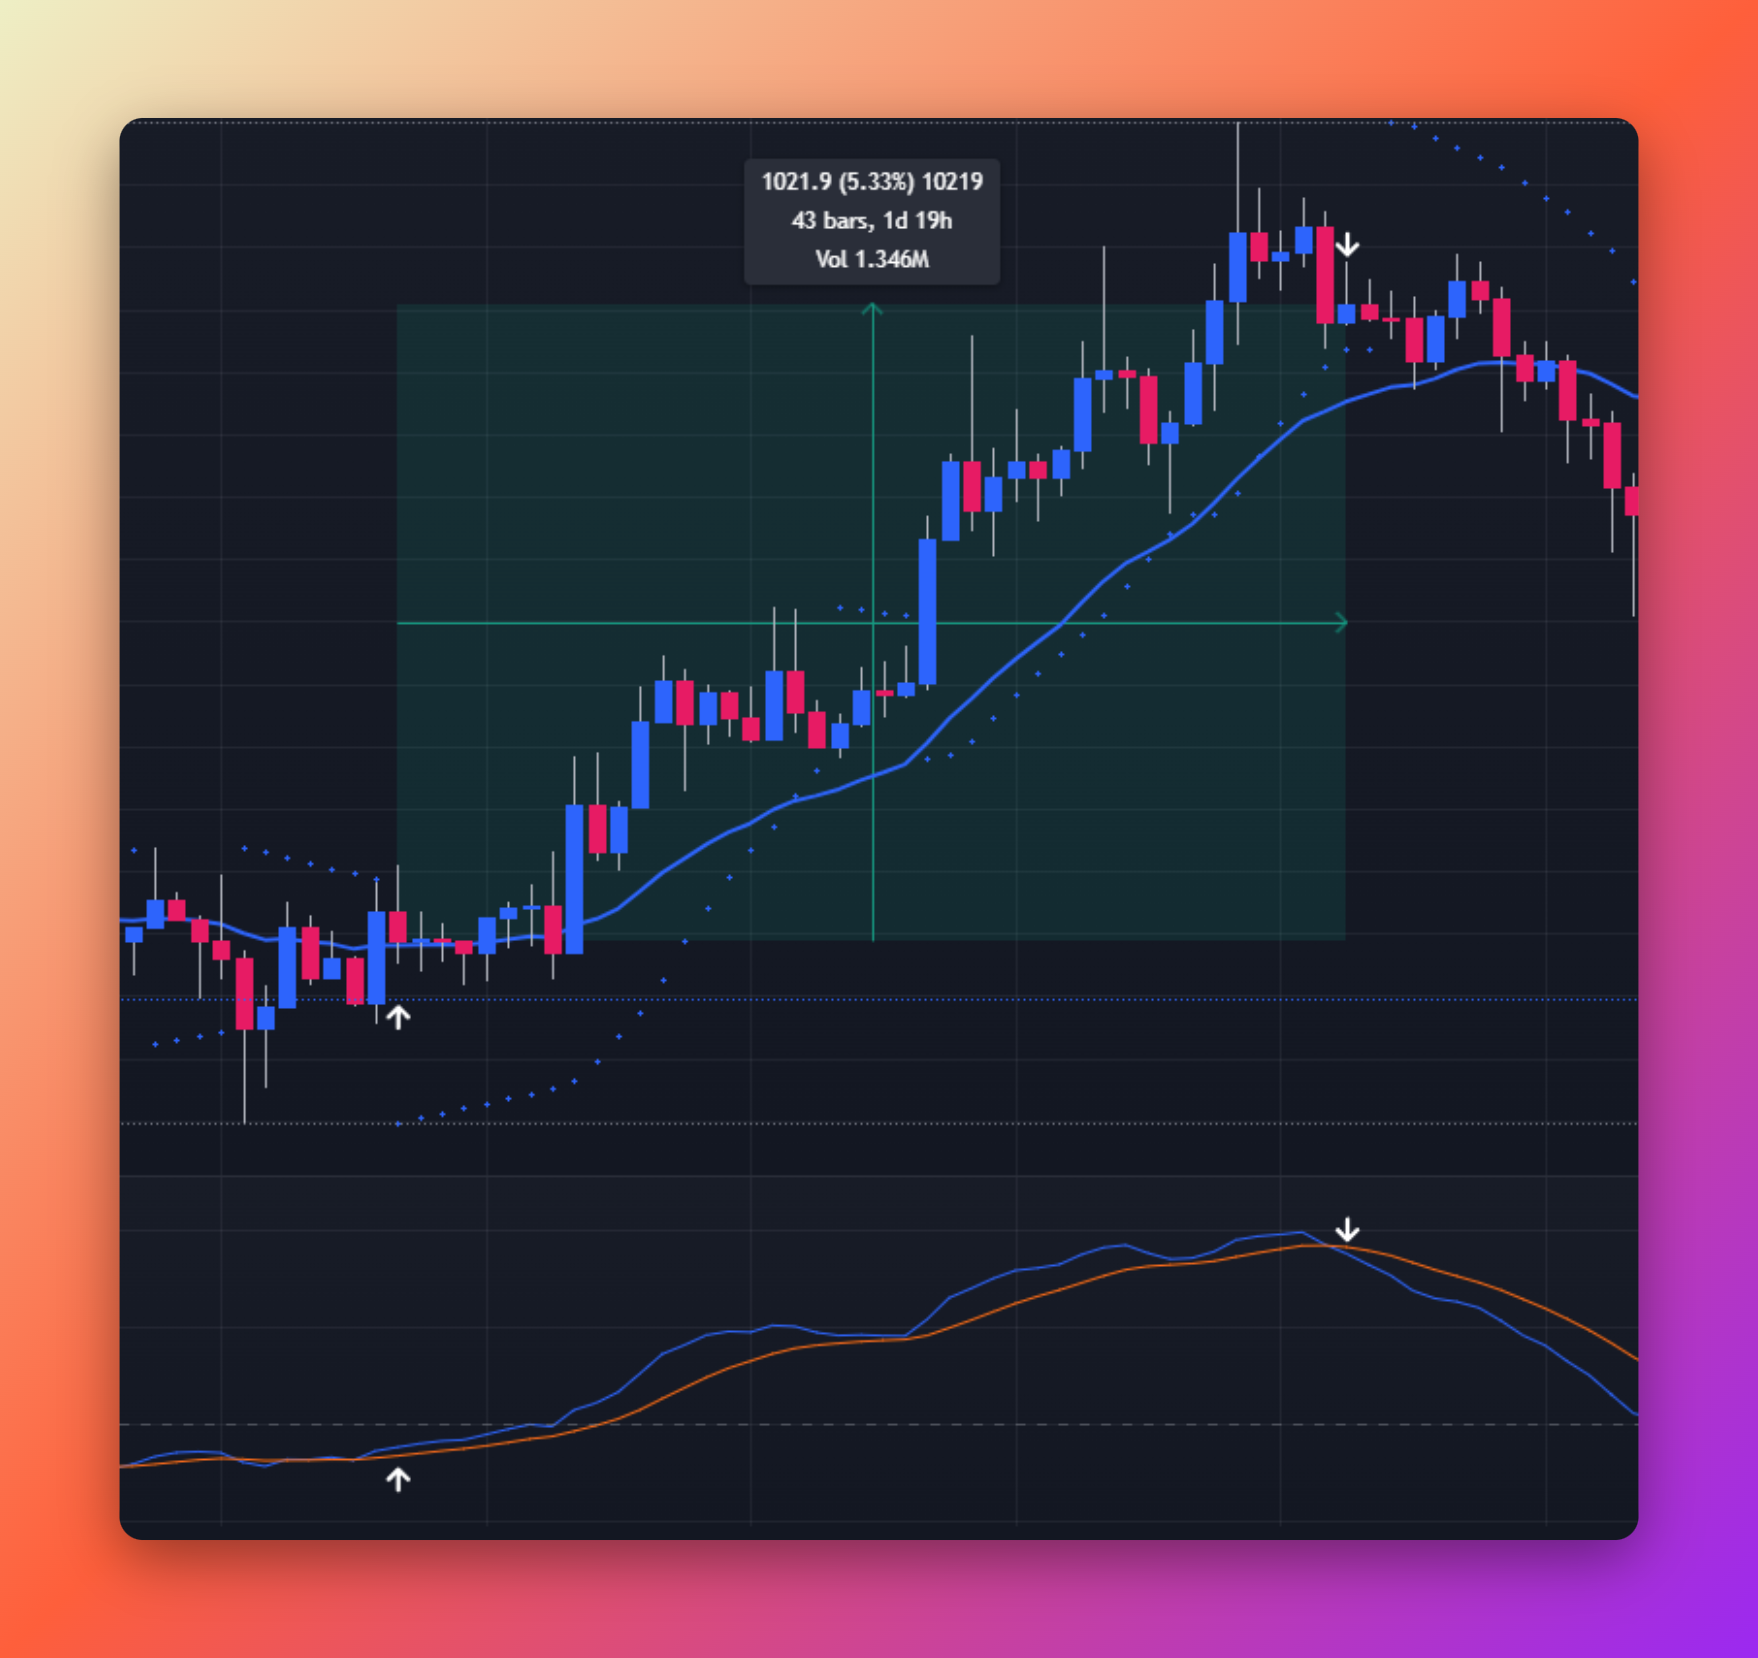
4. Downtrend with EMA, PSAR, MACD – SHORT trading strategy
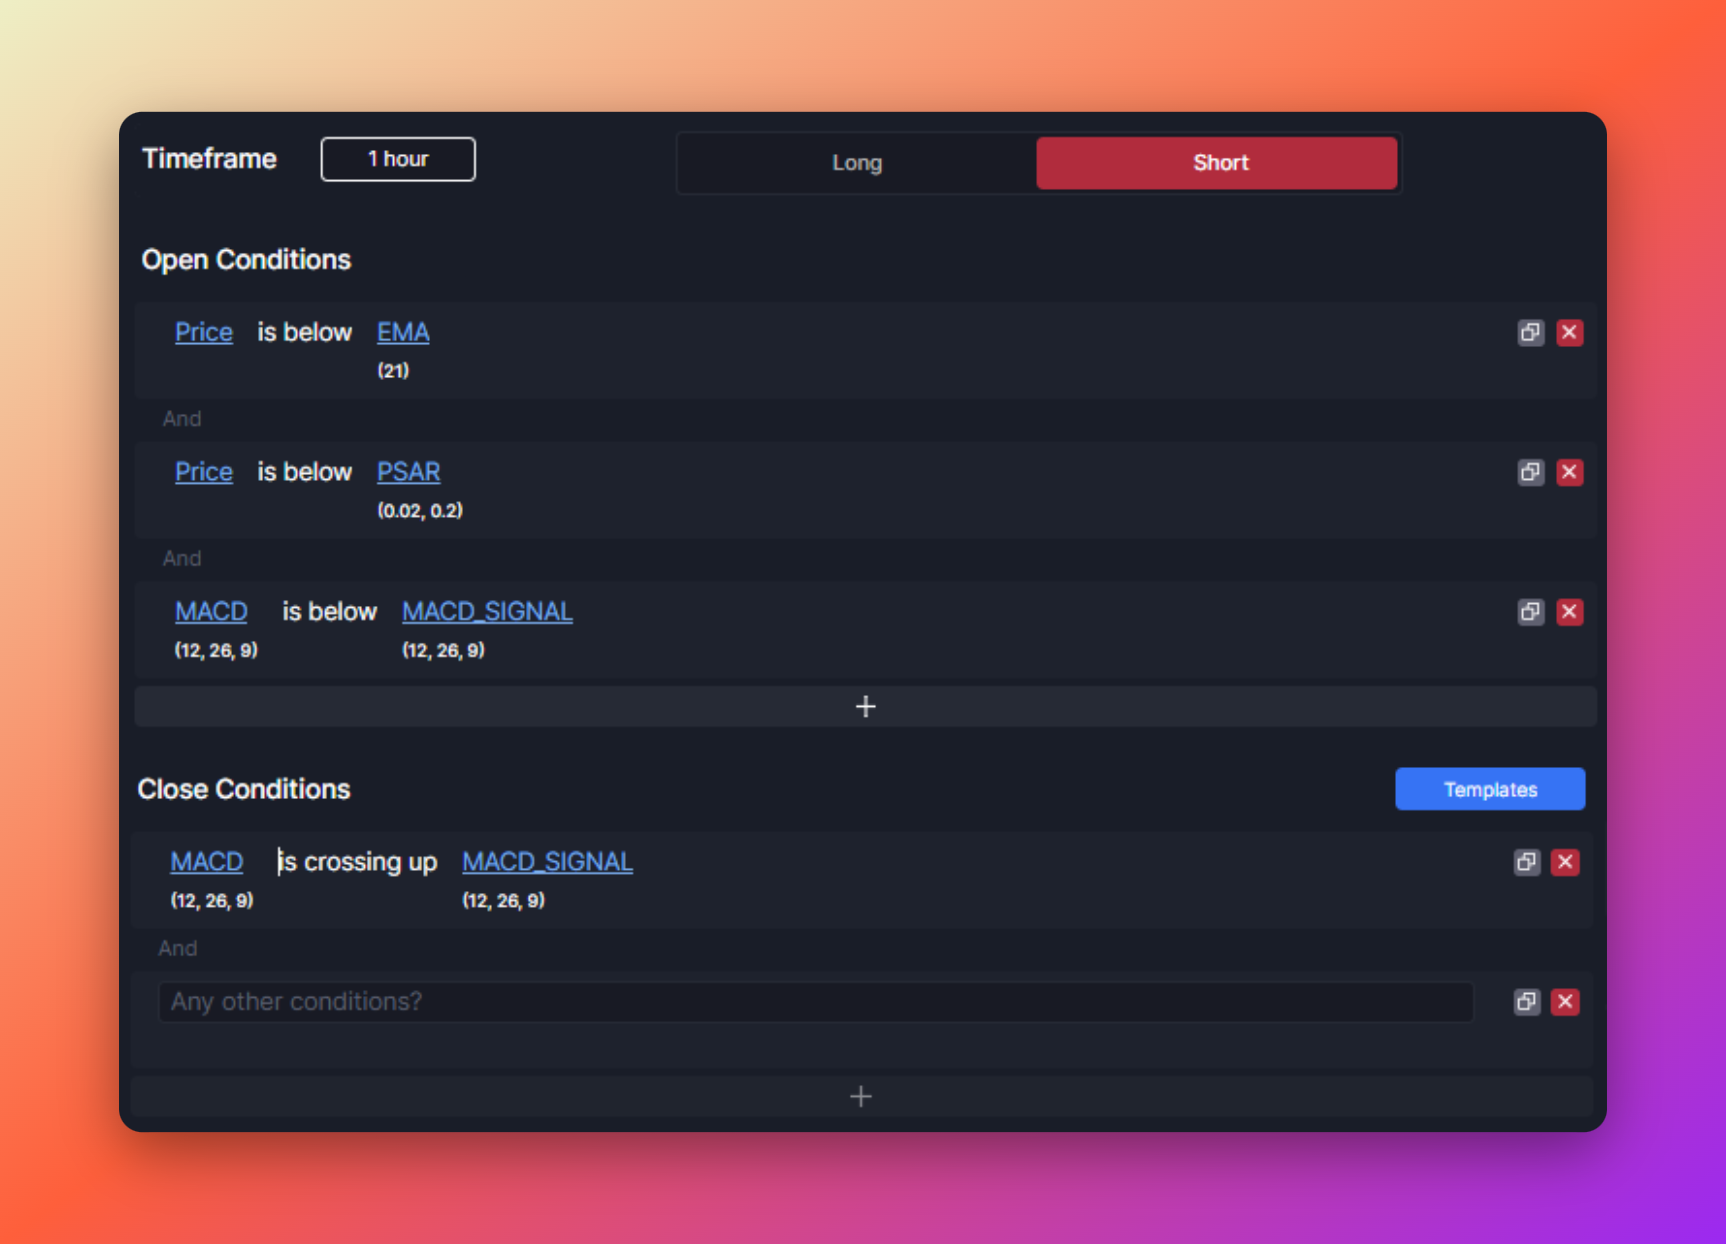
This setup opens a short (sell) position when the price is below EMA(21), Parabolic SAR, and when the MACD line is below the Signal line all on a 1-hour timeframe. Parabolic SAR and MACD indicators both have default settings.
This setup tends to profit in downtrending market conditions and should be avoided in ranging markets. You can change the timeframe to fit your preferences.
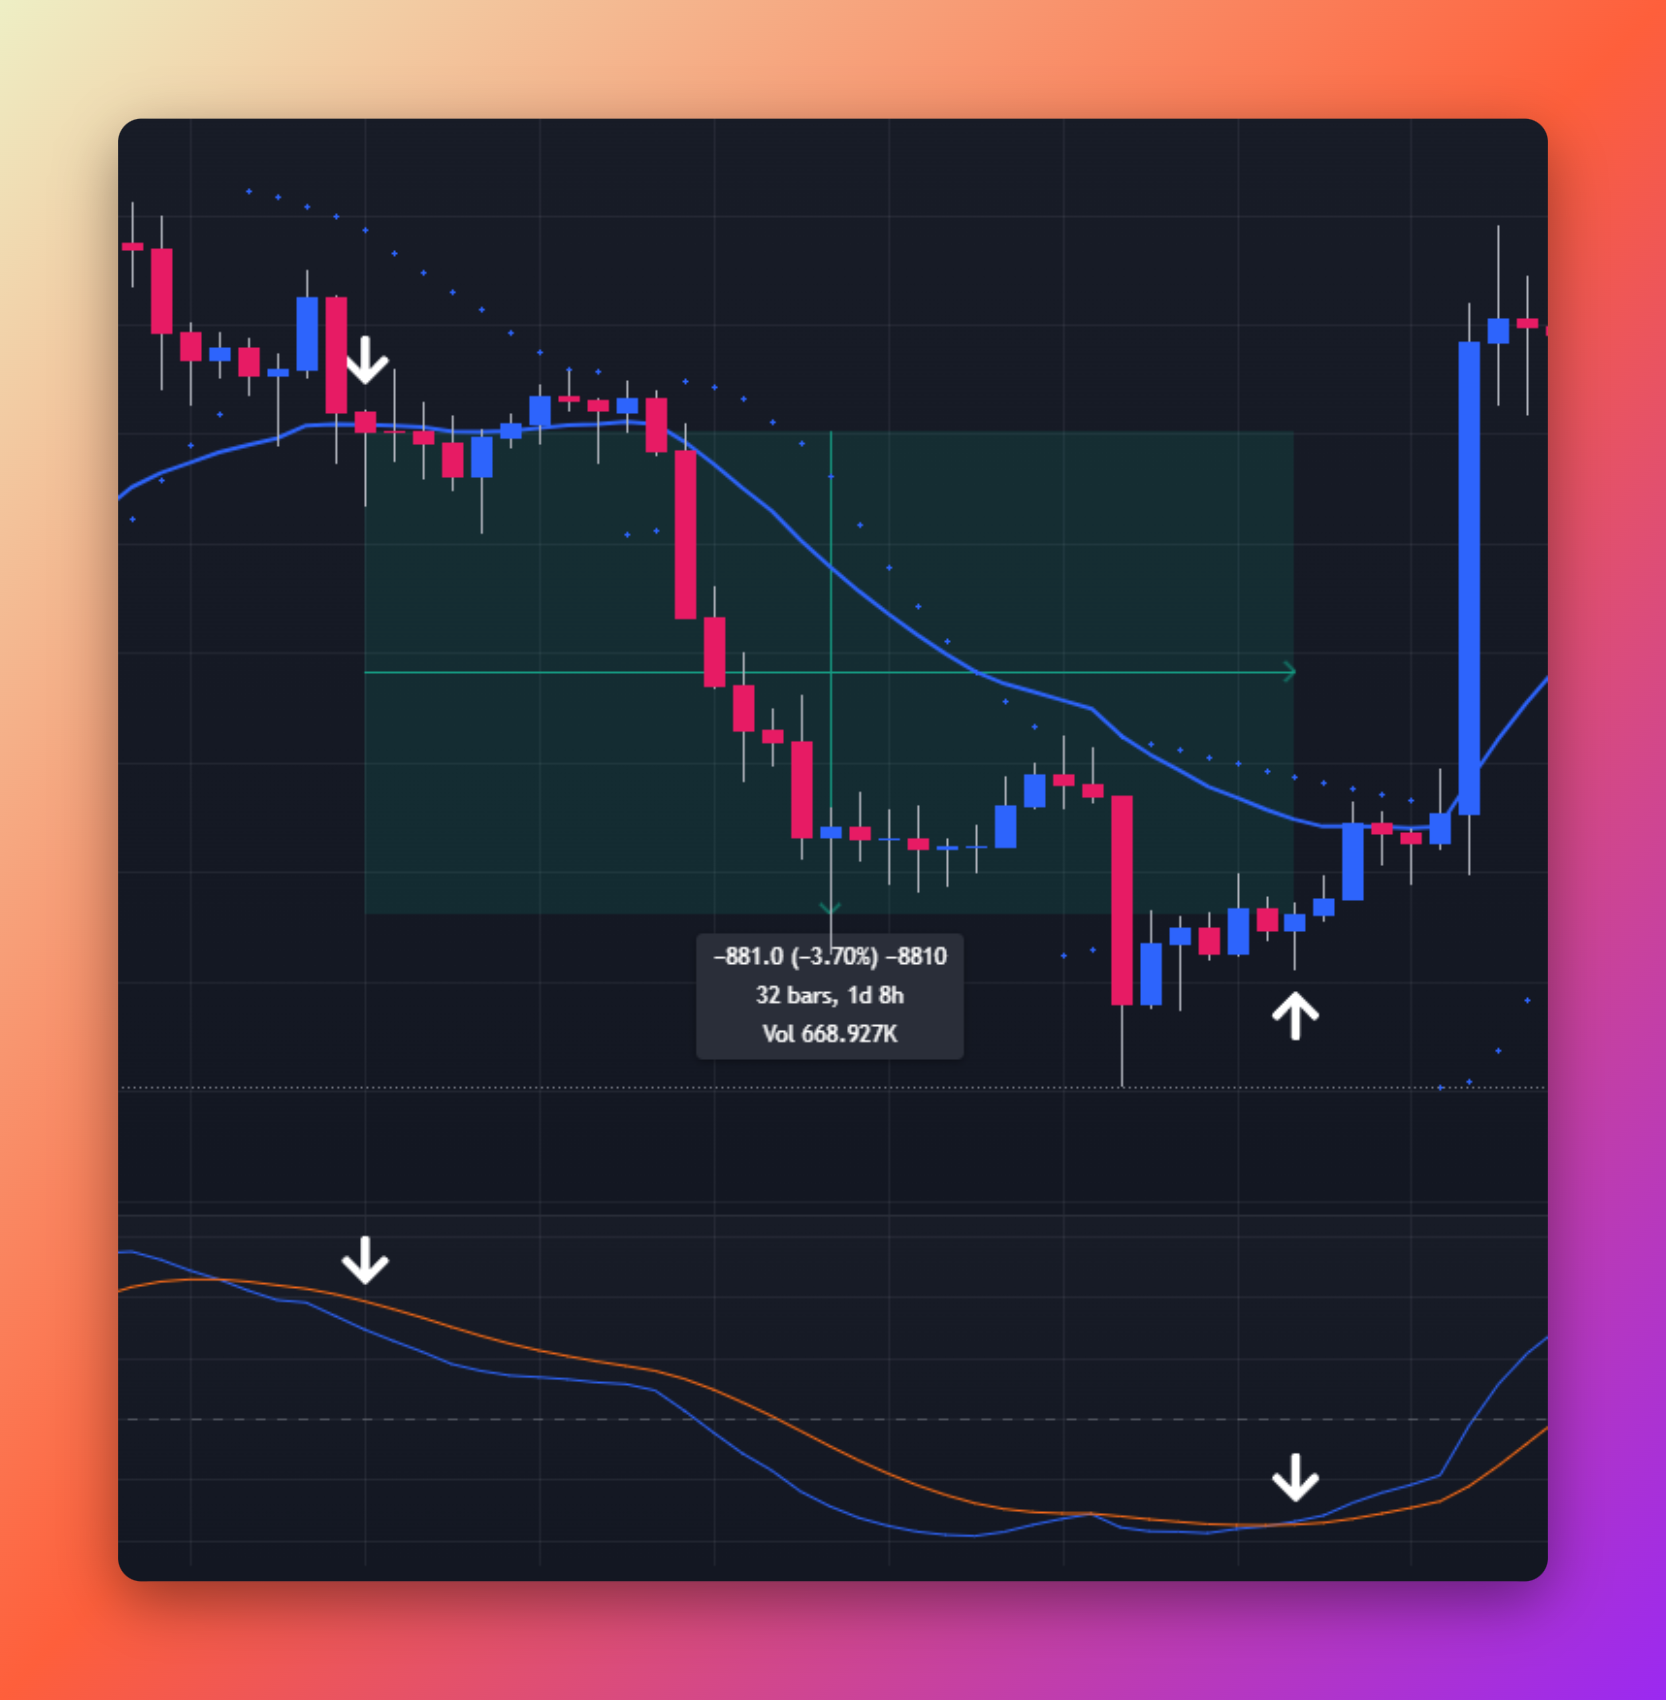
5. Moving average Golden Cross – LONG trading strategy
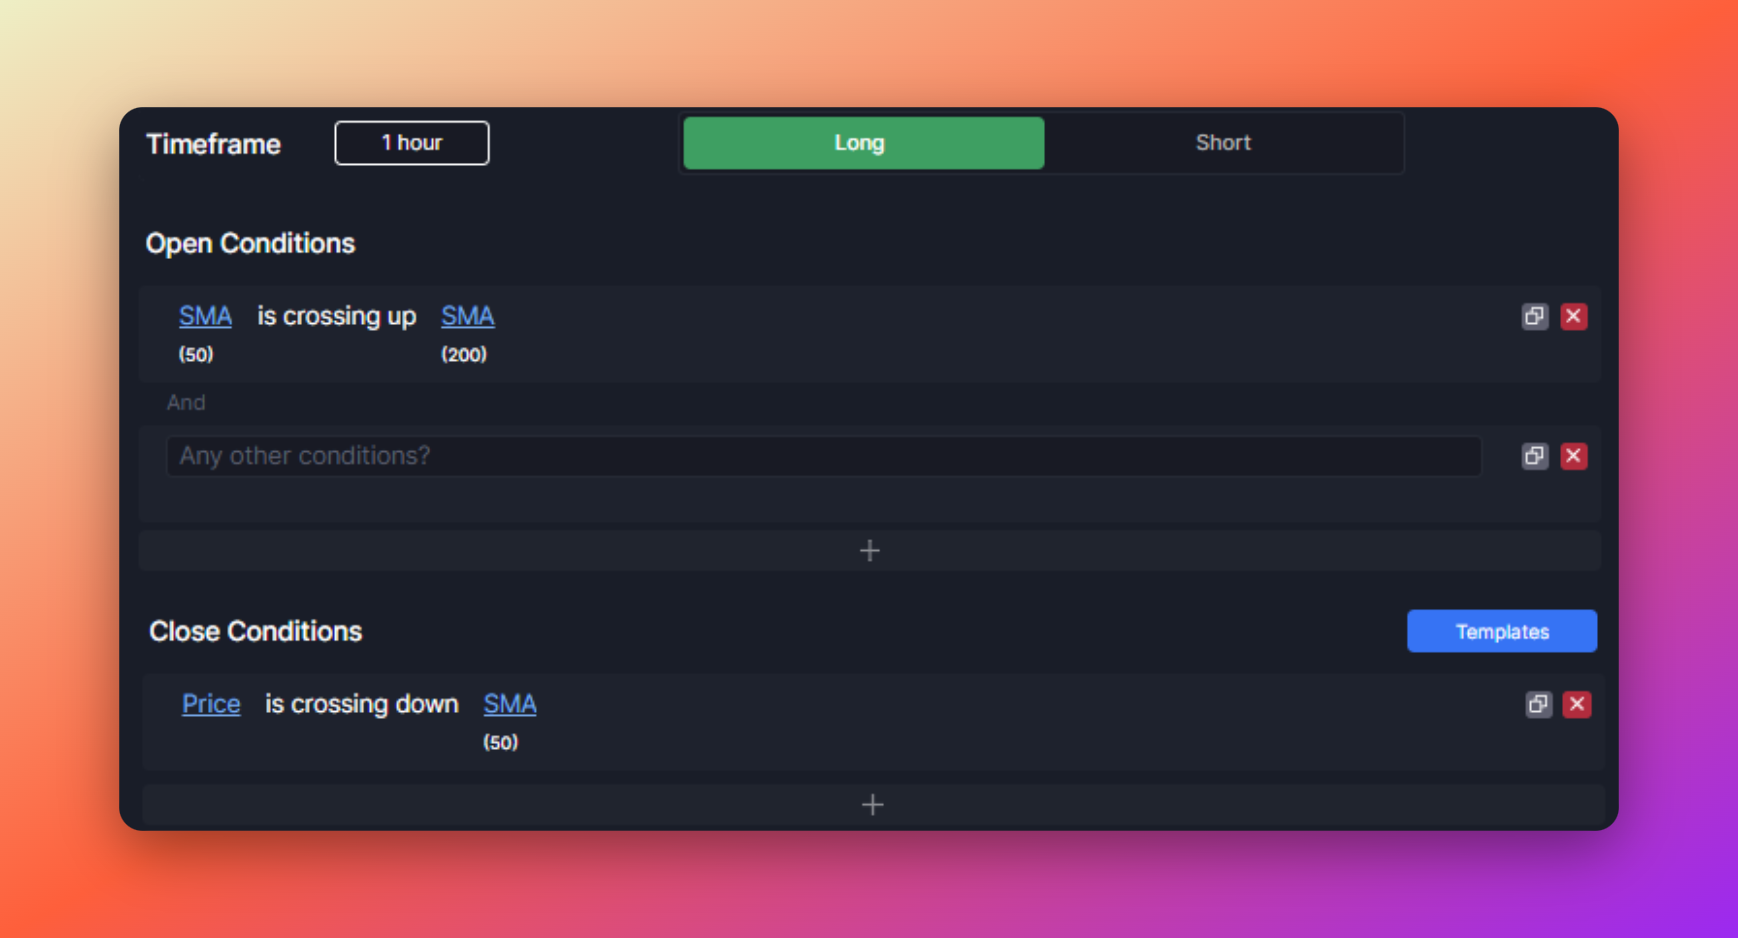
This setup opens a long (buy) position when the Simple Moving average (SMA) of period 50 is crossing up the SMA of period 200. This event is referred to as the Golden Cross. The exit conditions are set up to be faster: when Price is crossing down SMA(50).
You can change the timeframe or length of each moving average, or even the way it is calculated (Simple, Exponential, Hull, Kaufman Adaptive,…) to make the setup more responsive to current market movements.
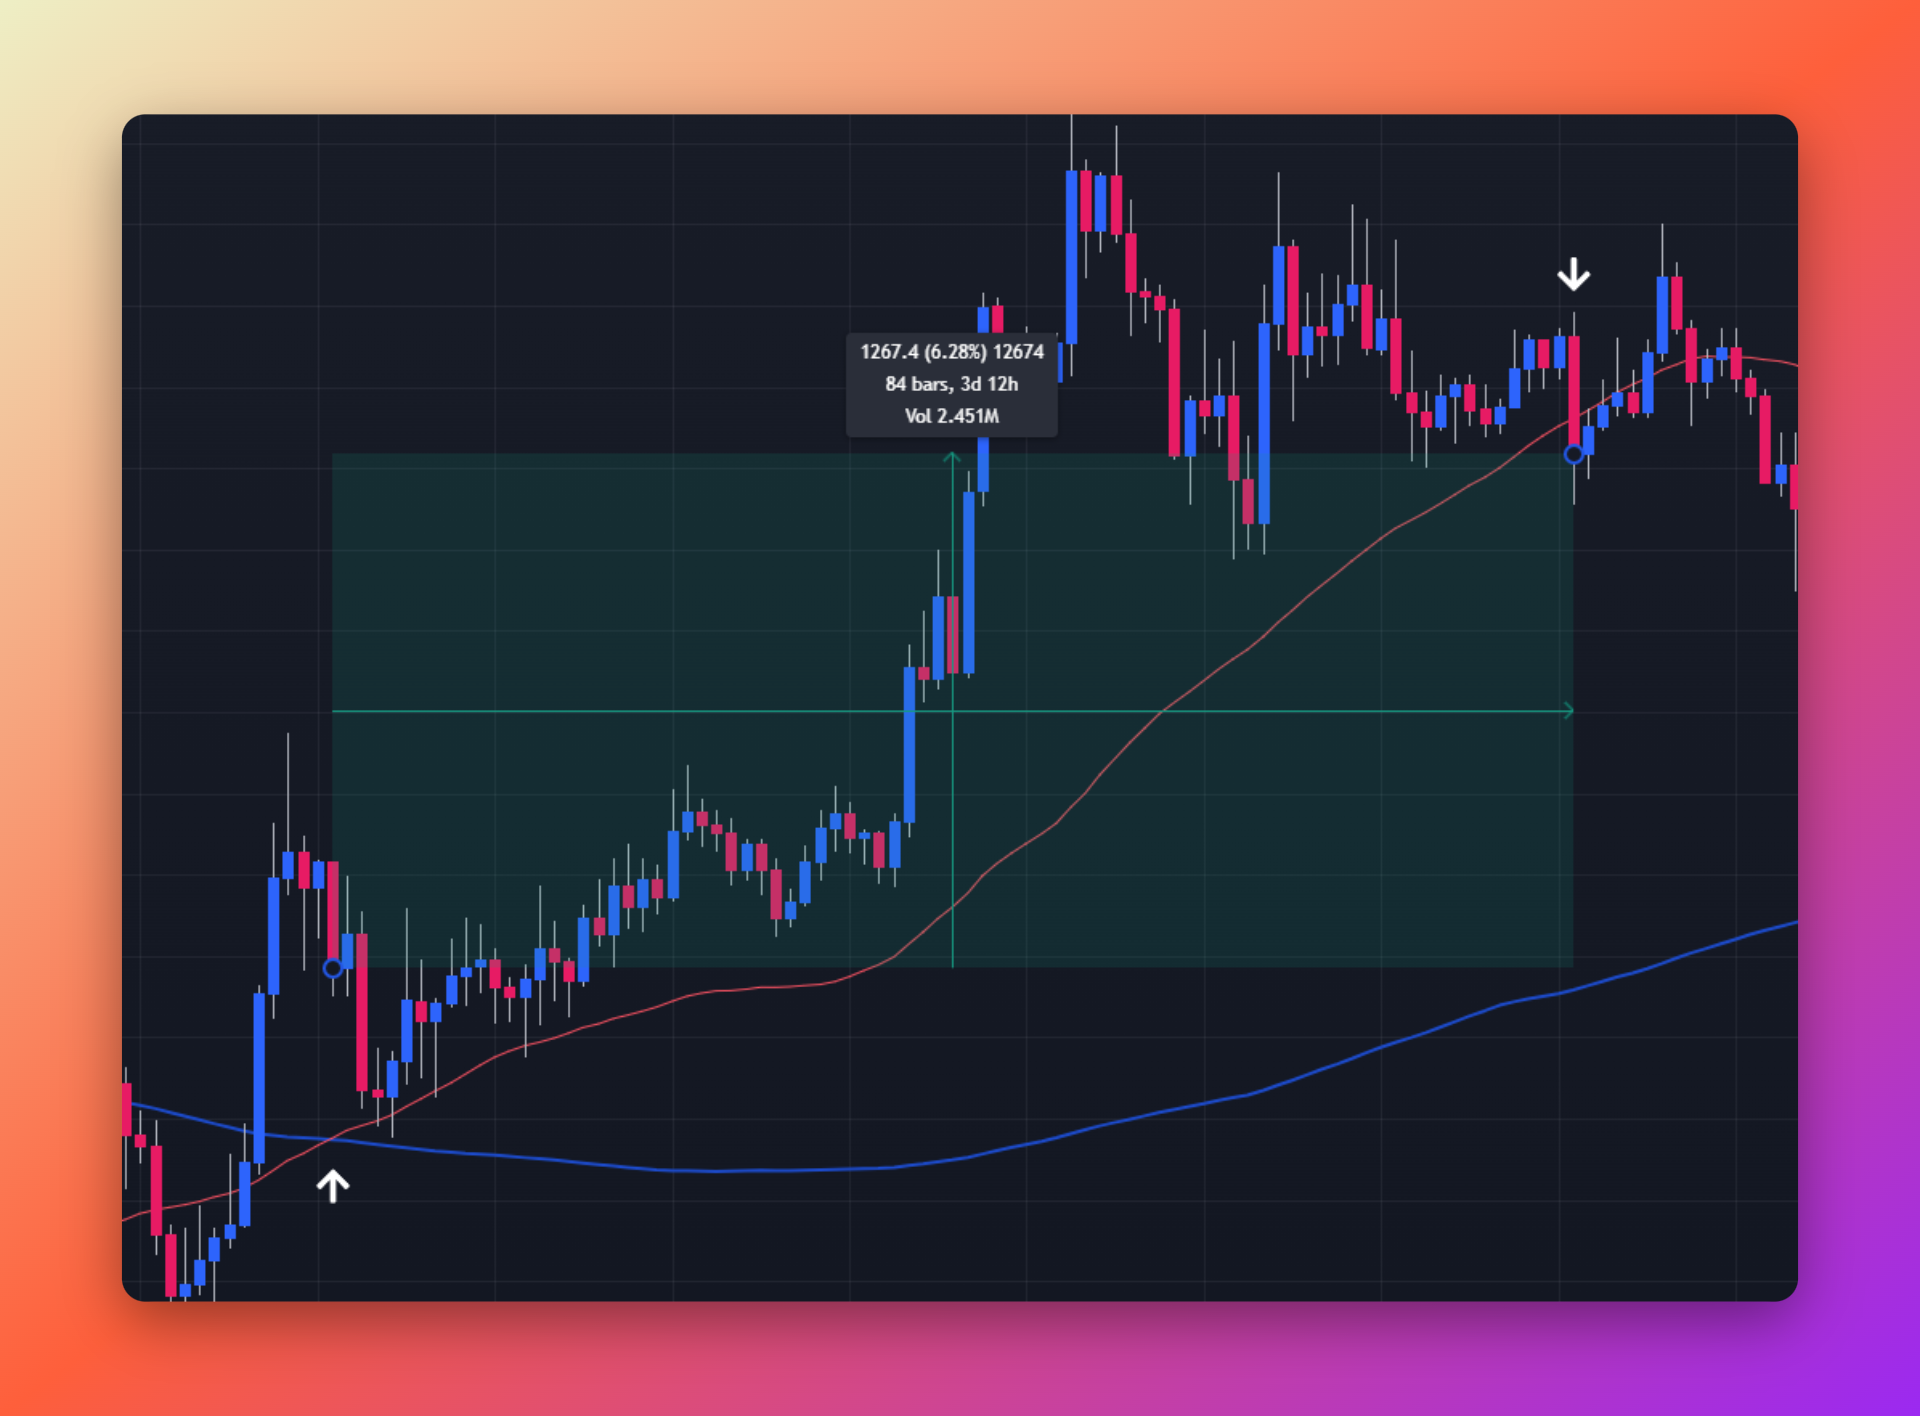
6. Moving average Death Cross – SHORT trading strategy
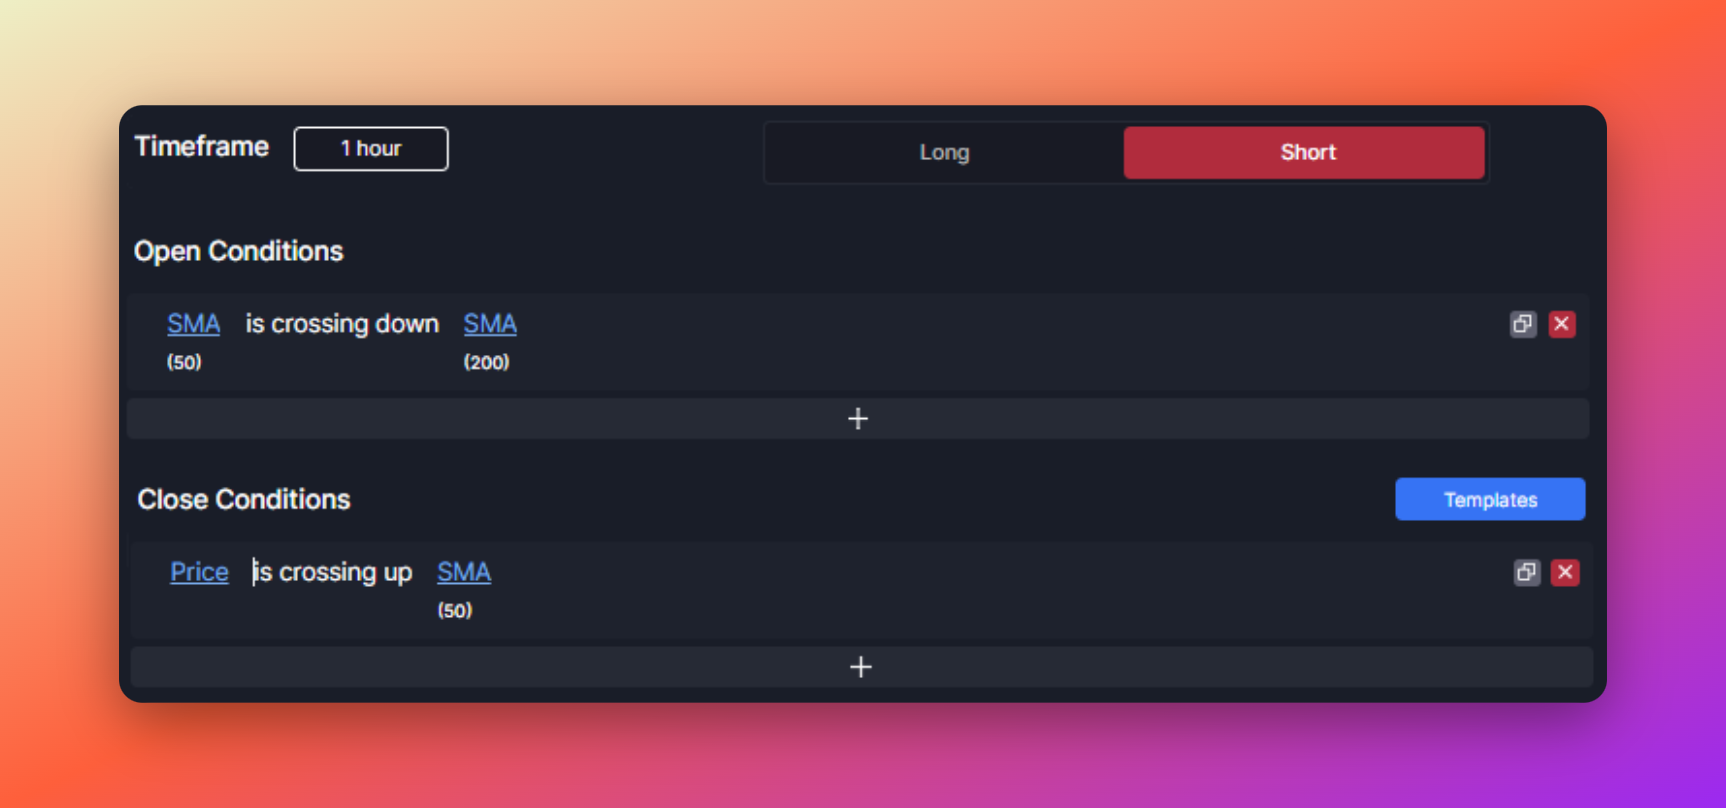
This setup opens a short (sell) position when the Simple Moving average (SMA) of period 50 is crossing down the SMA of period 200. This event is referred to as a Death Cross. The exit conditions are set up to be faster: when Price is crossing up the SMA(50).
You can change the timeframe or length of each moving average, or even the way it is calculated (Simple, Exponential, Hull, Kaufman Adaptive,…) to make the setup more responsive to current market movements.
General notes on moving crosses – they tend to be used as trend filters. So, instead of using their cross as a signal to trade as we’ve done in this template, you can combine these crosses with your trading strategy to filter out trading in market environments not favorable to your main entry and exit condition setup.
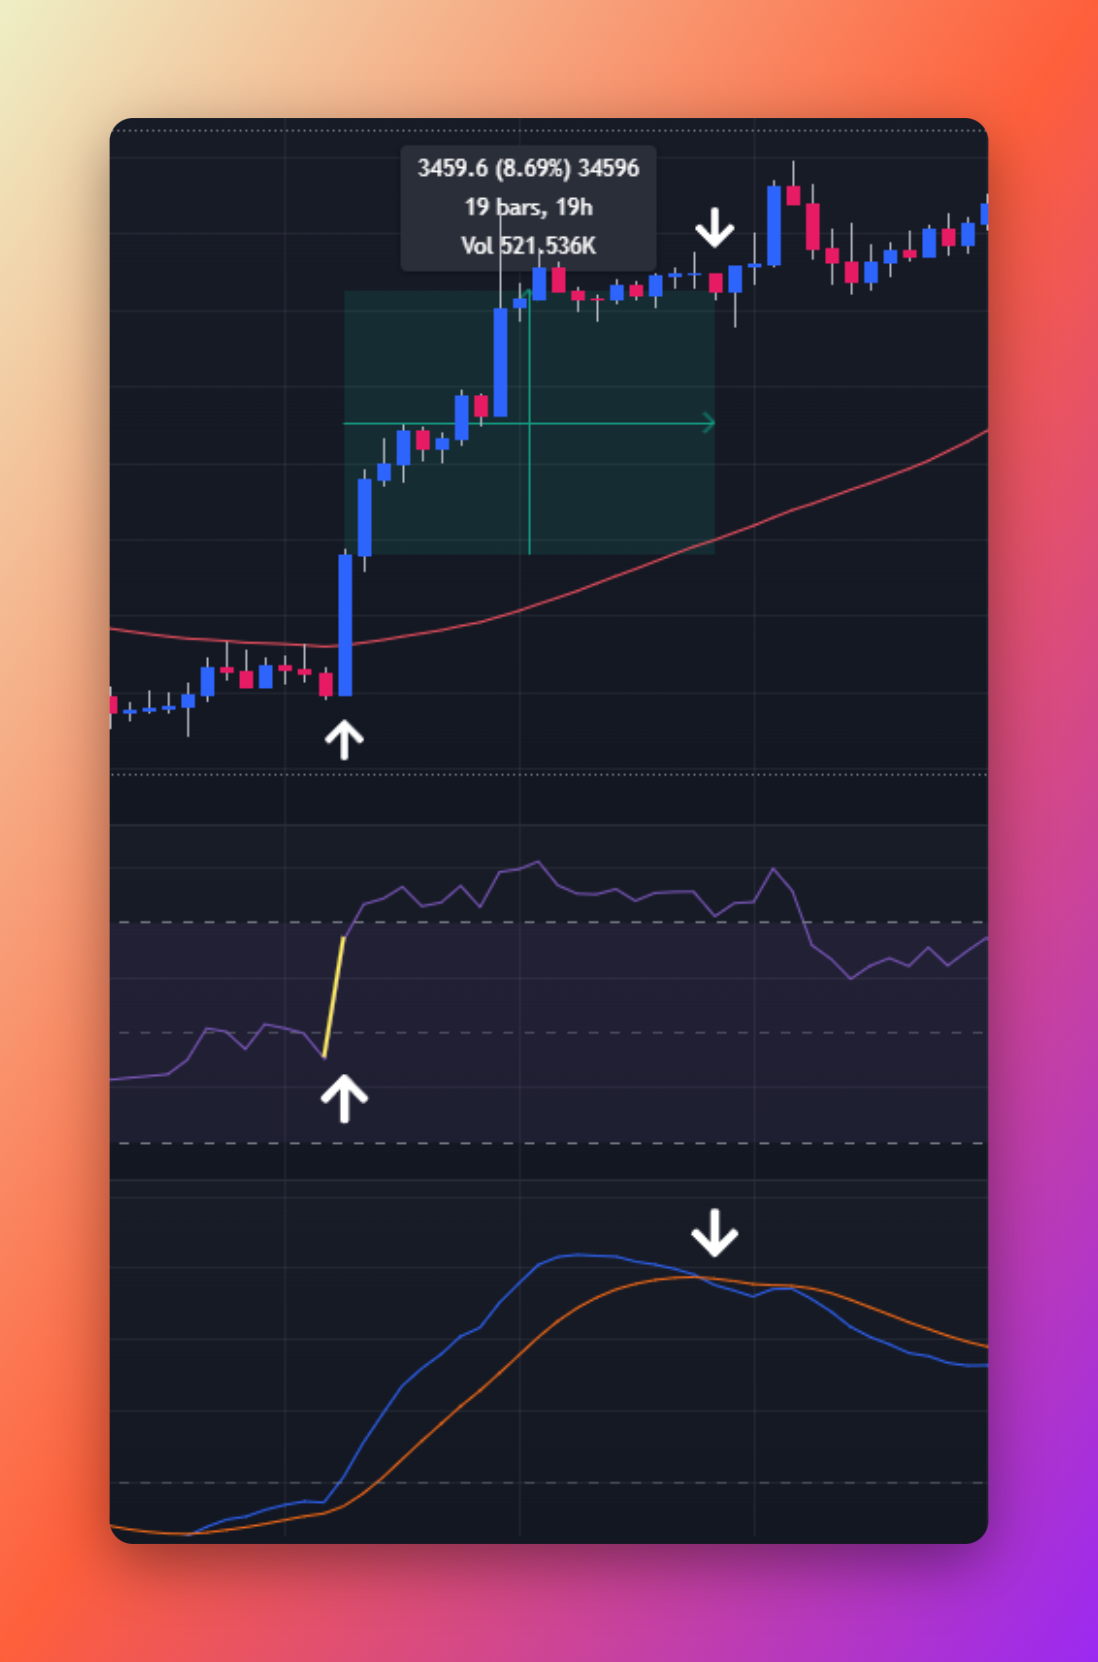
7. Upturn in momentum with RSI, SMA – LONG trading strategy
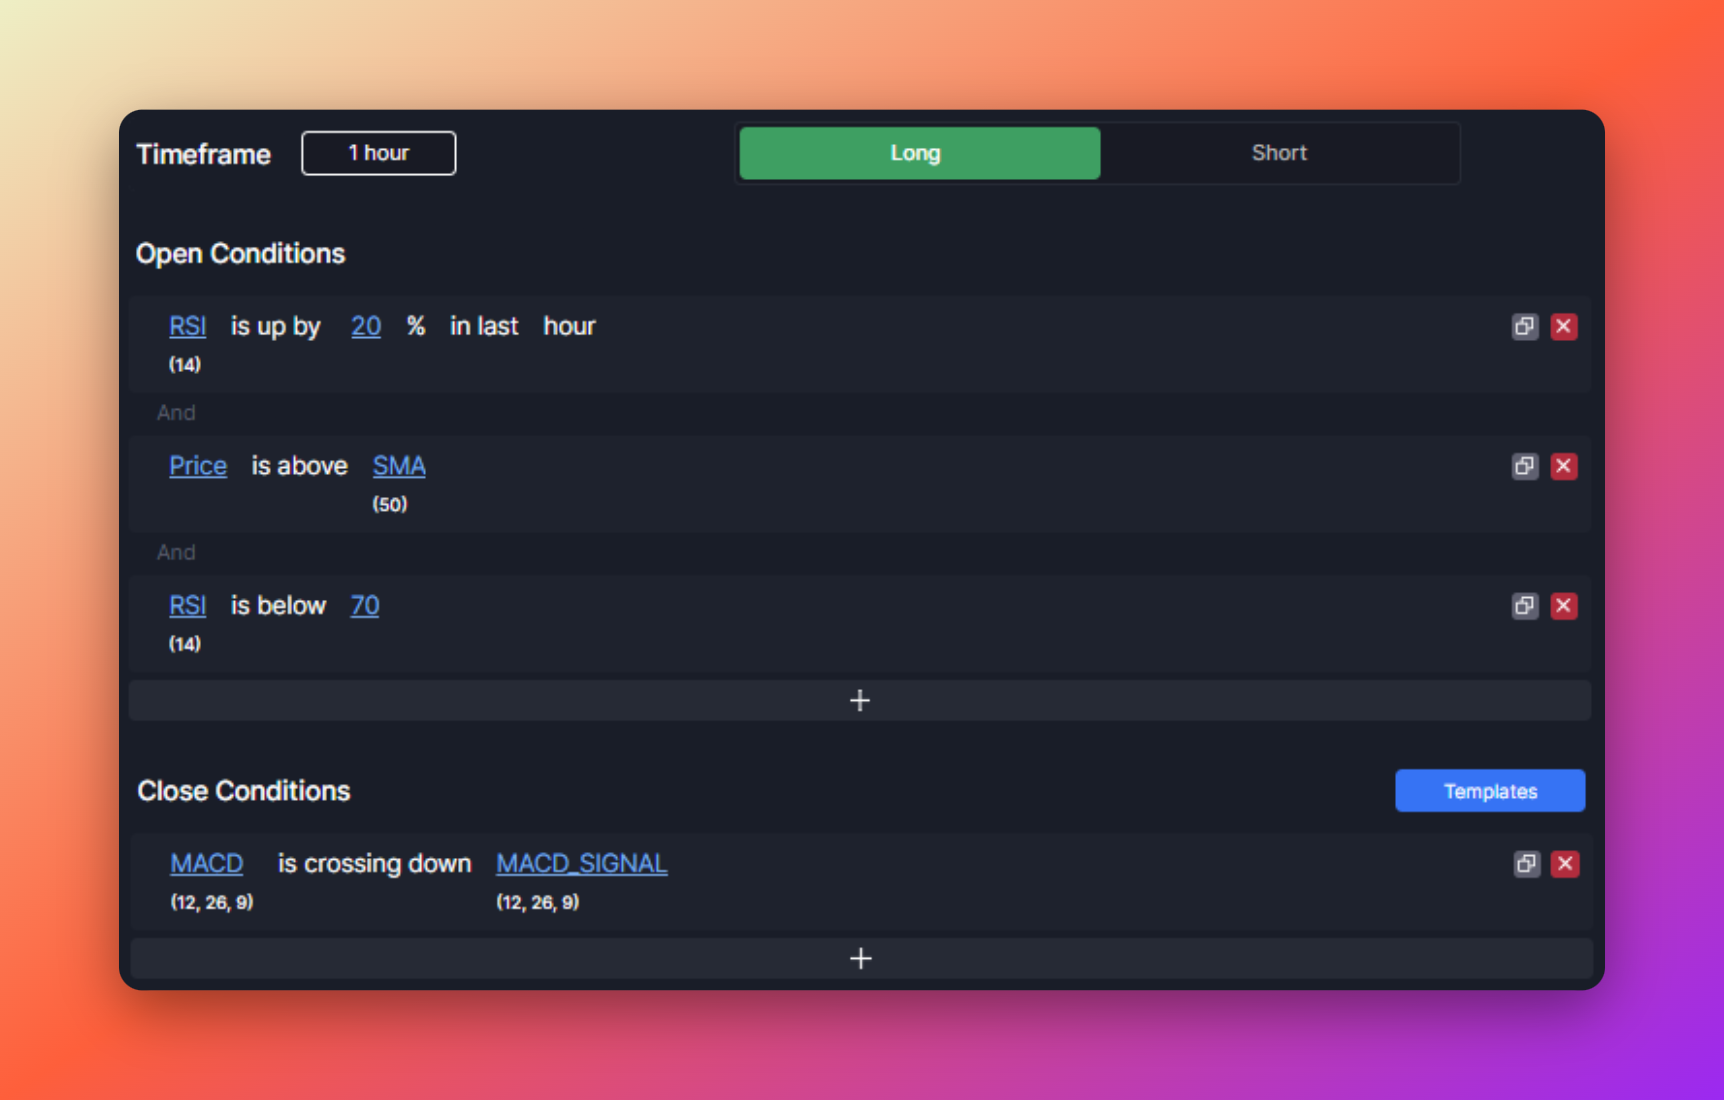
This setup opens a long (buy) position when the Relative Strength Index (RSI) of period 14 gains 20 % in a single hour, but is still not in overbought territory, and when Price is above the Simple Moving average (SMA) of period 50. The exit condition is focused on getting us out of the position as close to the top of the move as possible using the MACD line crossing the Signal line.
You can change the timeframe or length of the moving average, or even the way it is calculated (Simple, Exponential, Hull, Kaufman Adaptive,…), or the RSI look-back period to make the setup more responsive to current market movements.
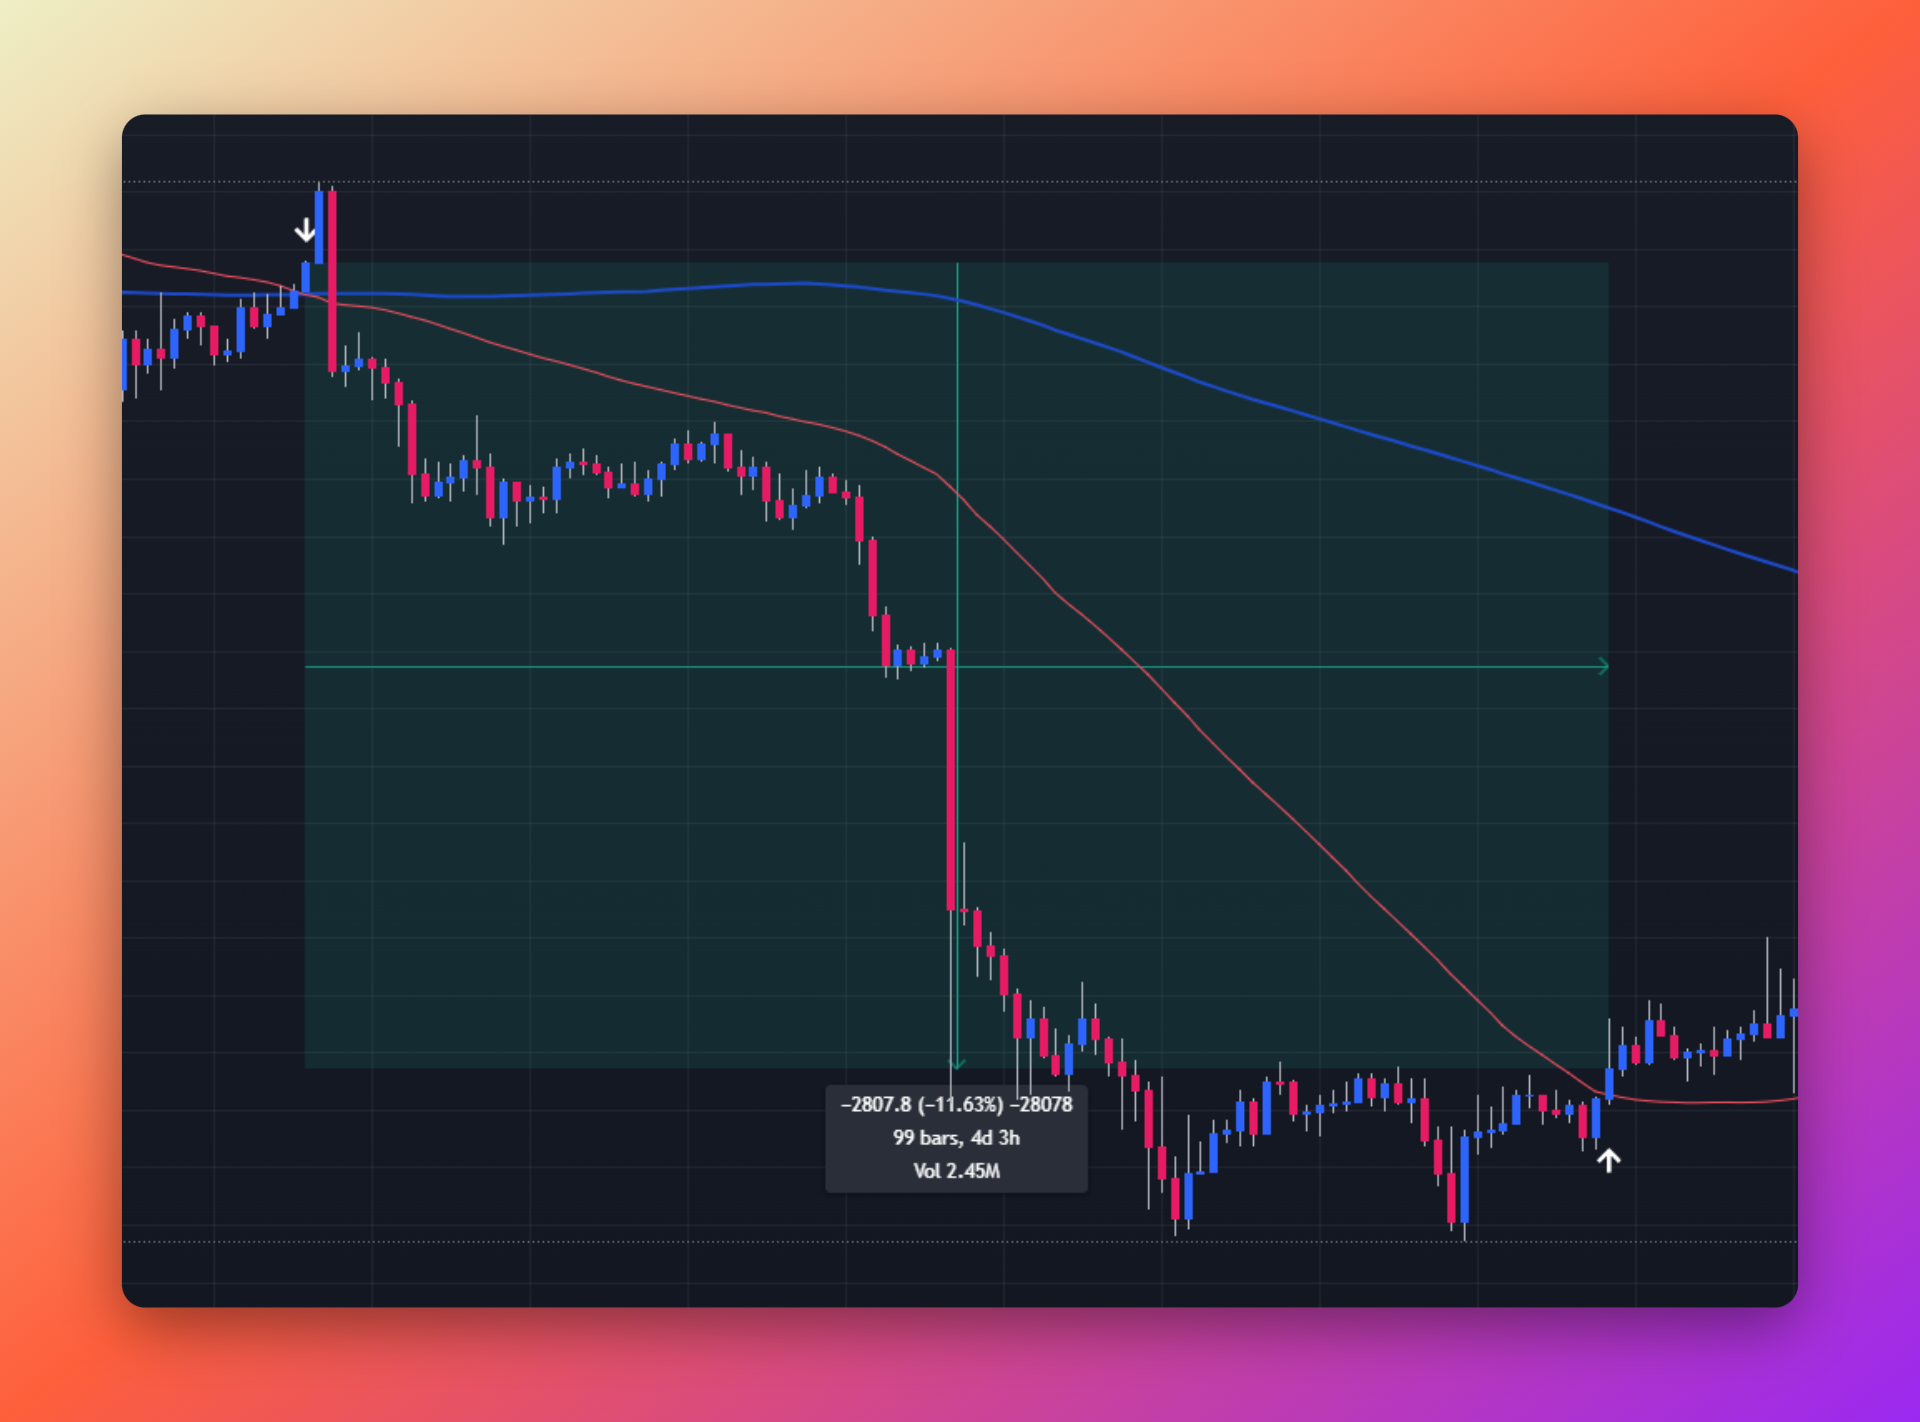
8. Downturn in momentum with RSI, SMA – SHORT trading strategy
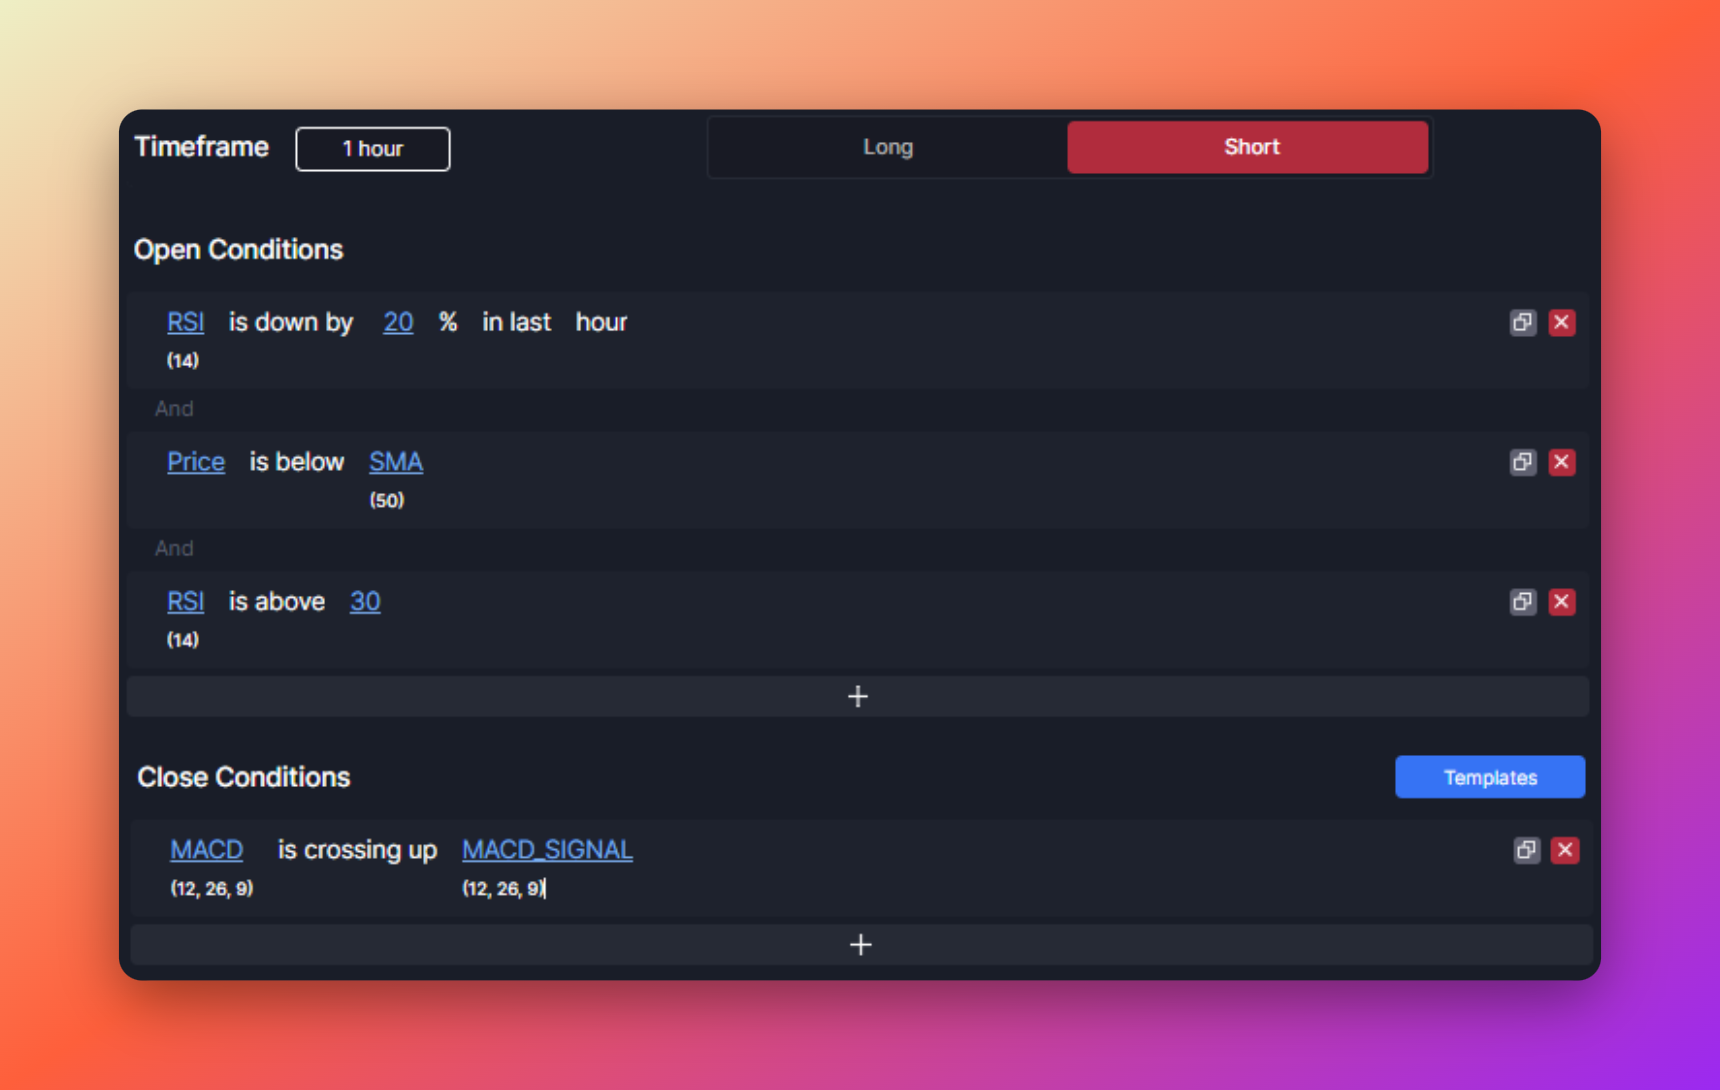
This setup opens a short (sell) position when the Relative Strength Index (RSI) of period 14 drops by 20 % in a single hour, but is still not in oversold territory, and when Price is below the Simple Moving average (SMA) of the period 50. The exit condition is focused on getting us out of the position as close to the bottom of the move as possible using the MACD line crossing the Signal line.
You can change the timeframe or length of the moving average, or even the way it is calculated (Simple, Exponential, Hull, Kaufman Adaptive,…), or the RSI look-back period to make the setup more responsive to current market movements.
9. Upward Momentum – LONG trading strategy
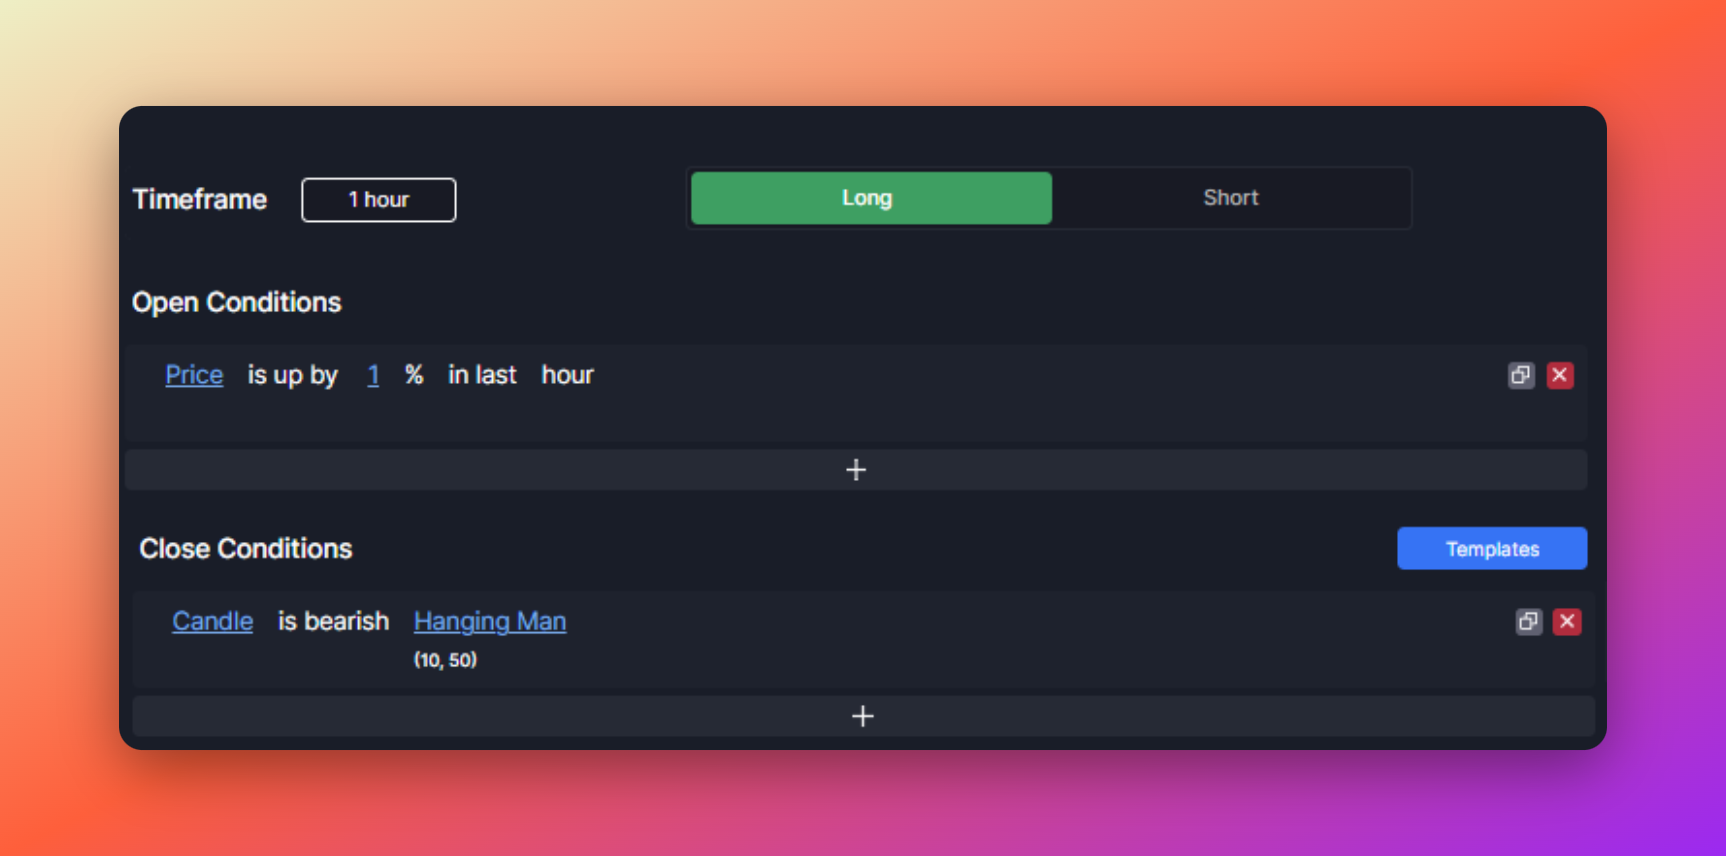
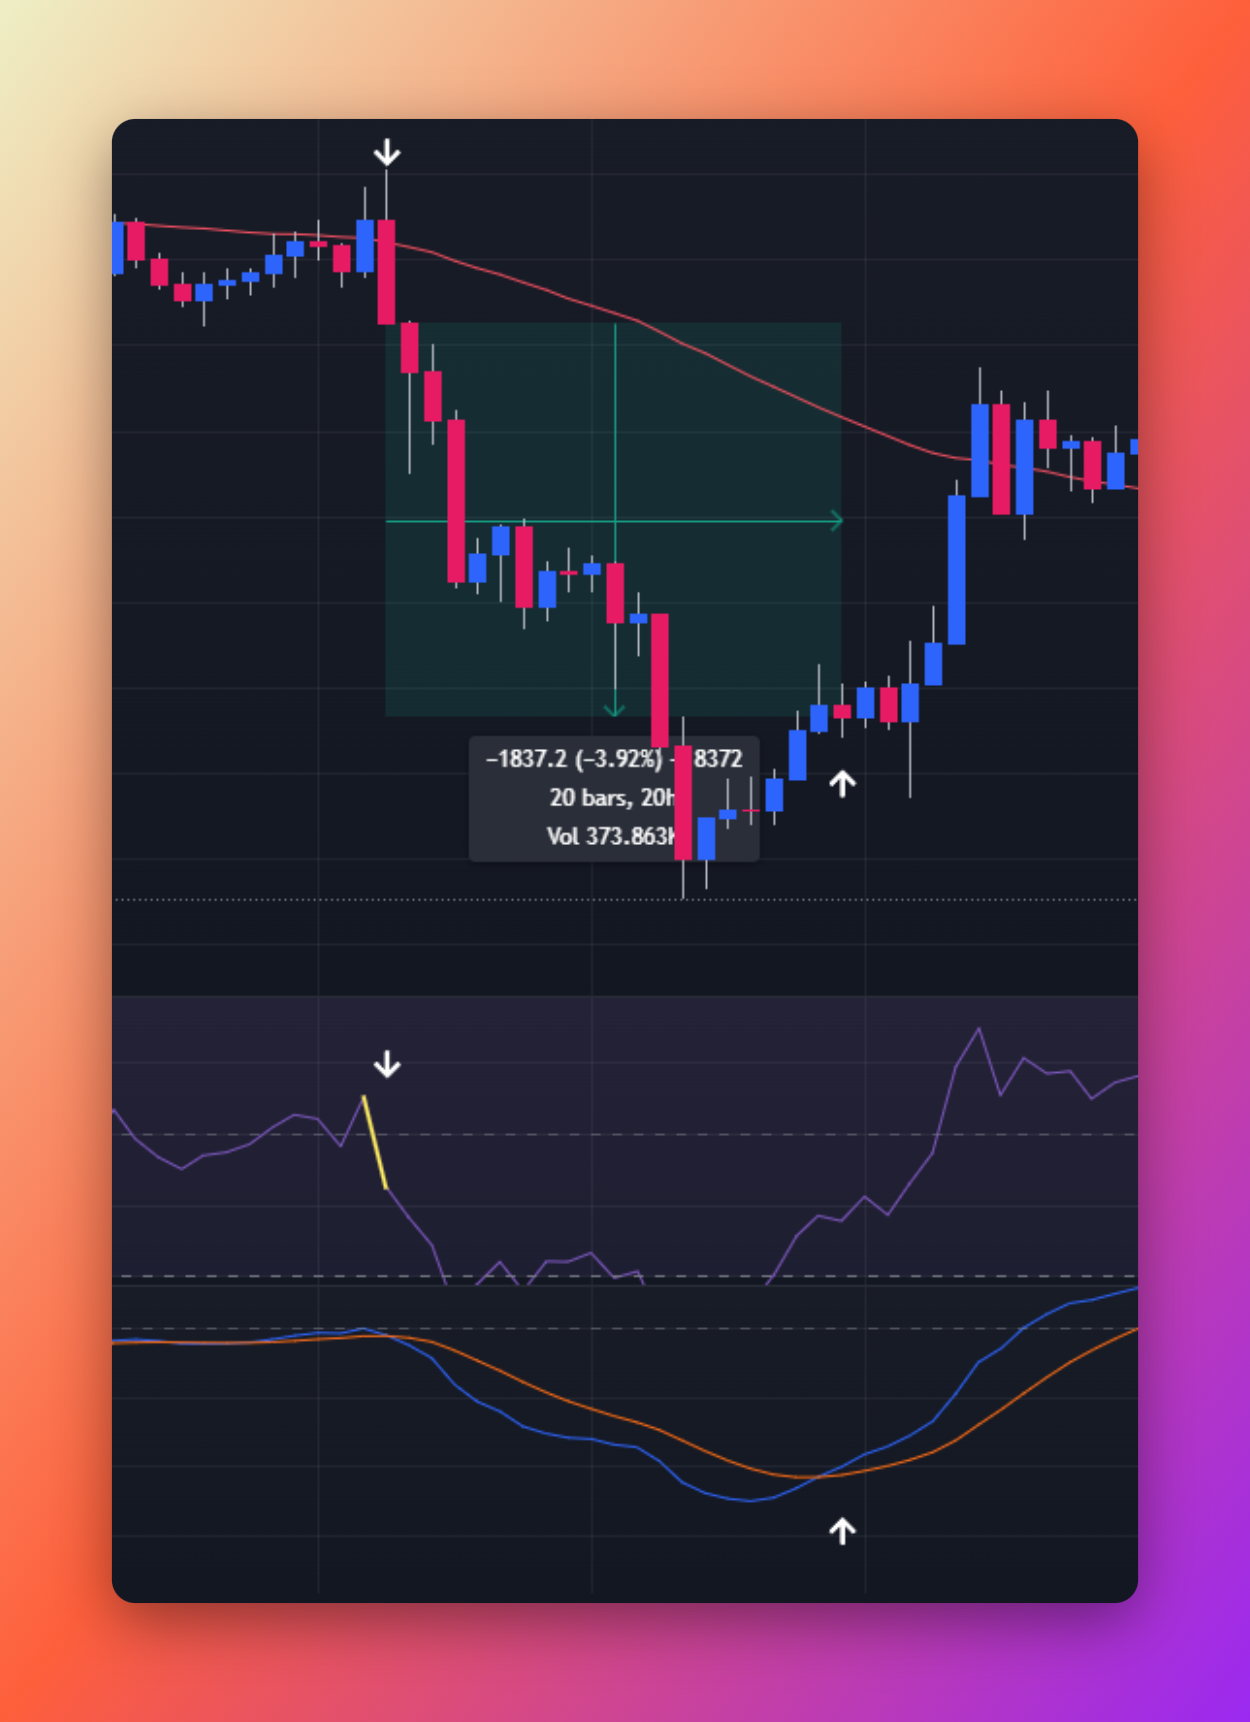
This simple setup opens a long (buy) position when the Price makes at least a 1% move up within a single hour. The exit condition is set for a bearish Hanging Man Candle, but it is strongly suggested to pair this template with a layered Asset Management strategy – with multiple Take Profit orders.
10. Downward Momentum – SHORT trading strategy
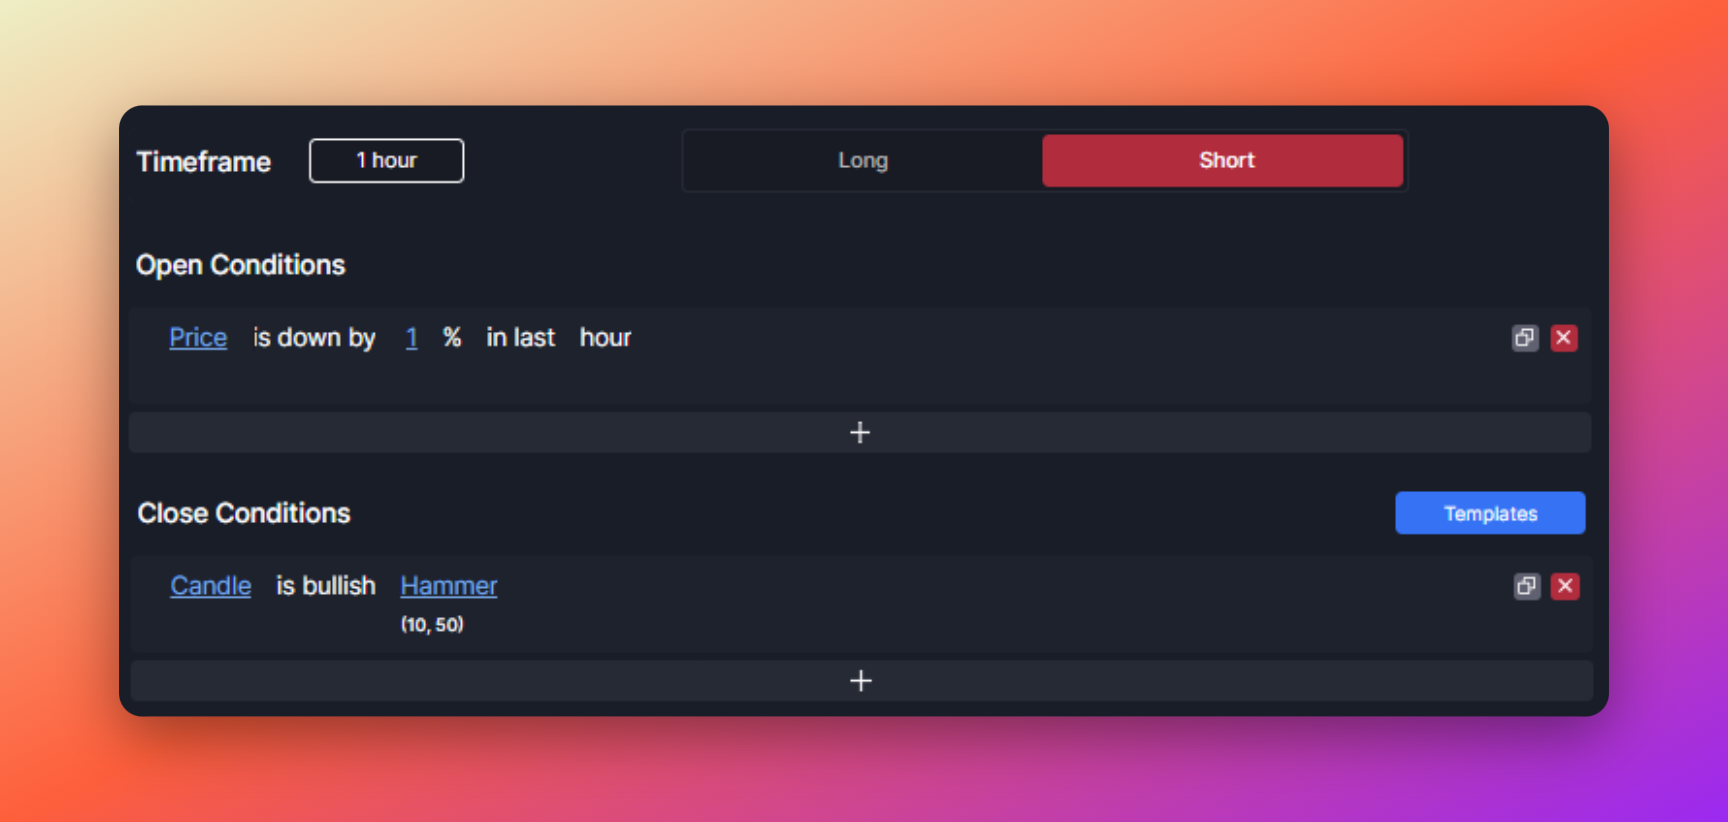
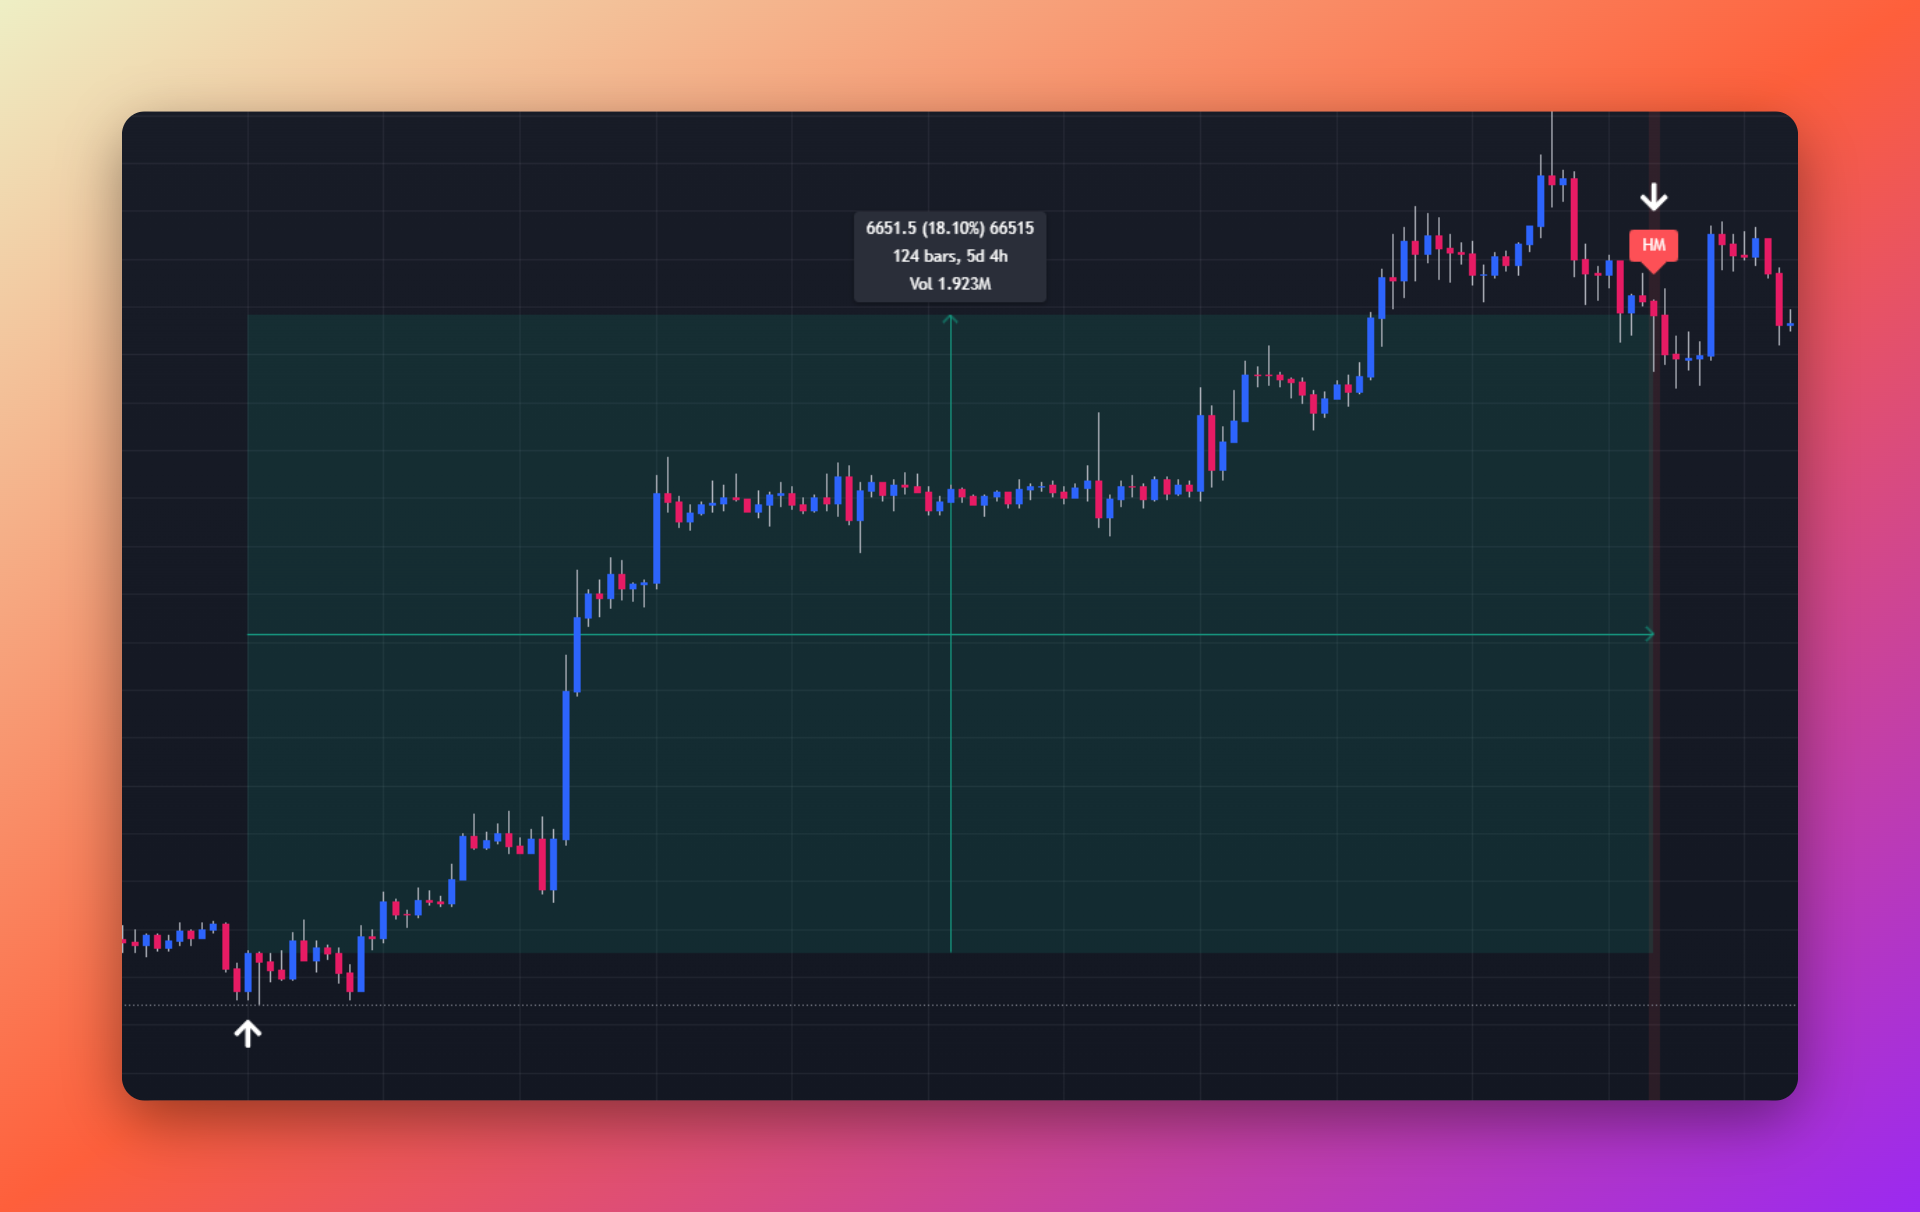
This simple setup opens a short (sell) position when the Price makes at least a 1% move down within a single hour. The exit condition is set for a bullish Hammer Candle, but it is strongly suggested to pair this template with a layered Asset Management strategy – with multiple Take Profit orders.
What other indicators can I backtest with, or use to create crypto bots?
If you want to use different indicators or build a strategy from scratch check out the full list of what you can find in the platform.
Conclusion
We’ve introduced these 10 trading setups as templates – a starting point on your trading journey. None of these setups should be used on their own in a vacuum. In general, trading using technical indicators as a sole entry or exit signal is not the best approach. You should observe the current market structure and put up a trend filter (at the very least) before plugging any of these setups into your trading. Don’t forget – you can modify the conditions, periods of the indicators, their timeframe, or even the asset they are evaluated on, add other conditions, and generally play around within the platform to find something you want to use in your trading.
These templates are meant to showcase what the Cleo Trading Platform is capable of. The trade examples were hand-picked from BTCUSDT chart. In the platform, you can find dozens of data points: technical indicators, price action, candlestick formations, and other types of data, that you can explore before committing to any trading approach. And if you want more data points – such as sentiment, fundamental data, on-chain analysis, or anything else – feel free to send us an email. If there’ll be big enough demand, we’ll be more than happy to implement it.
If you’d like to try these setups for yourself, head to cleo.finance to gain access to all these setups for free as templates and start using them right away.