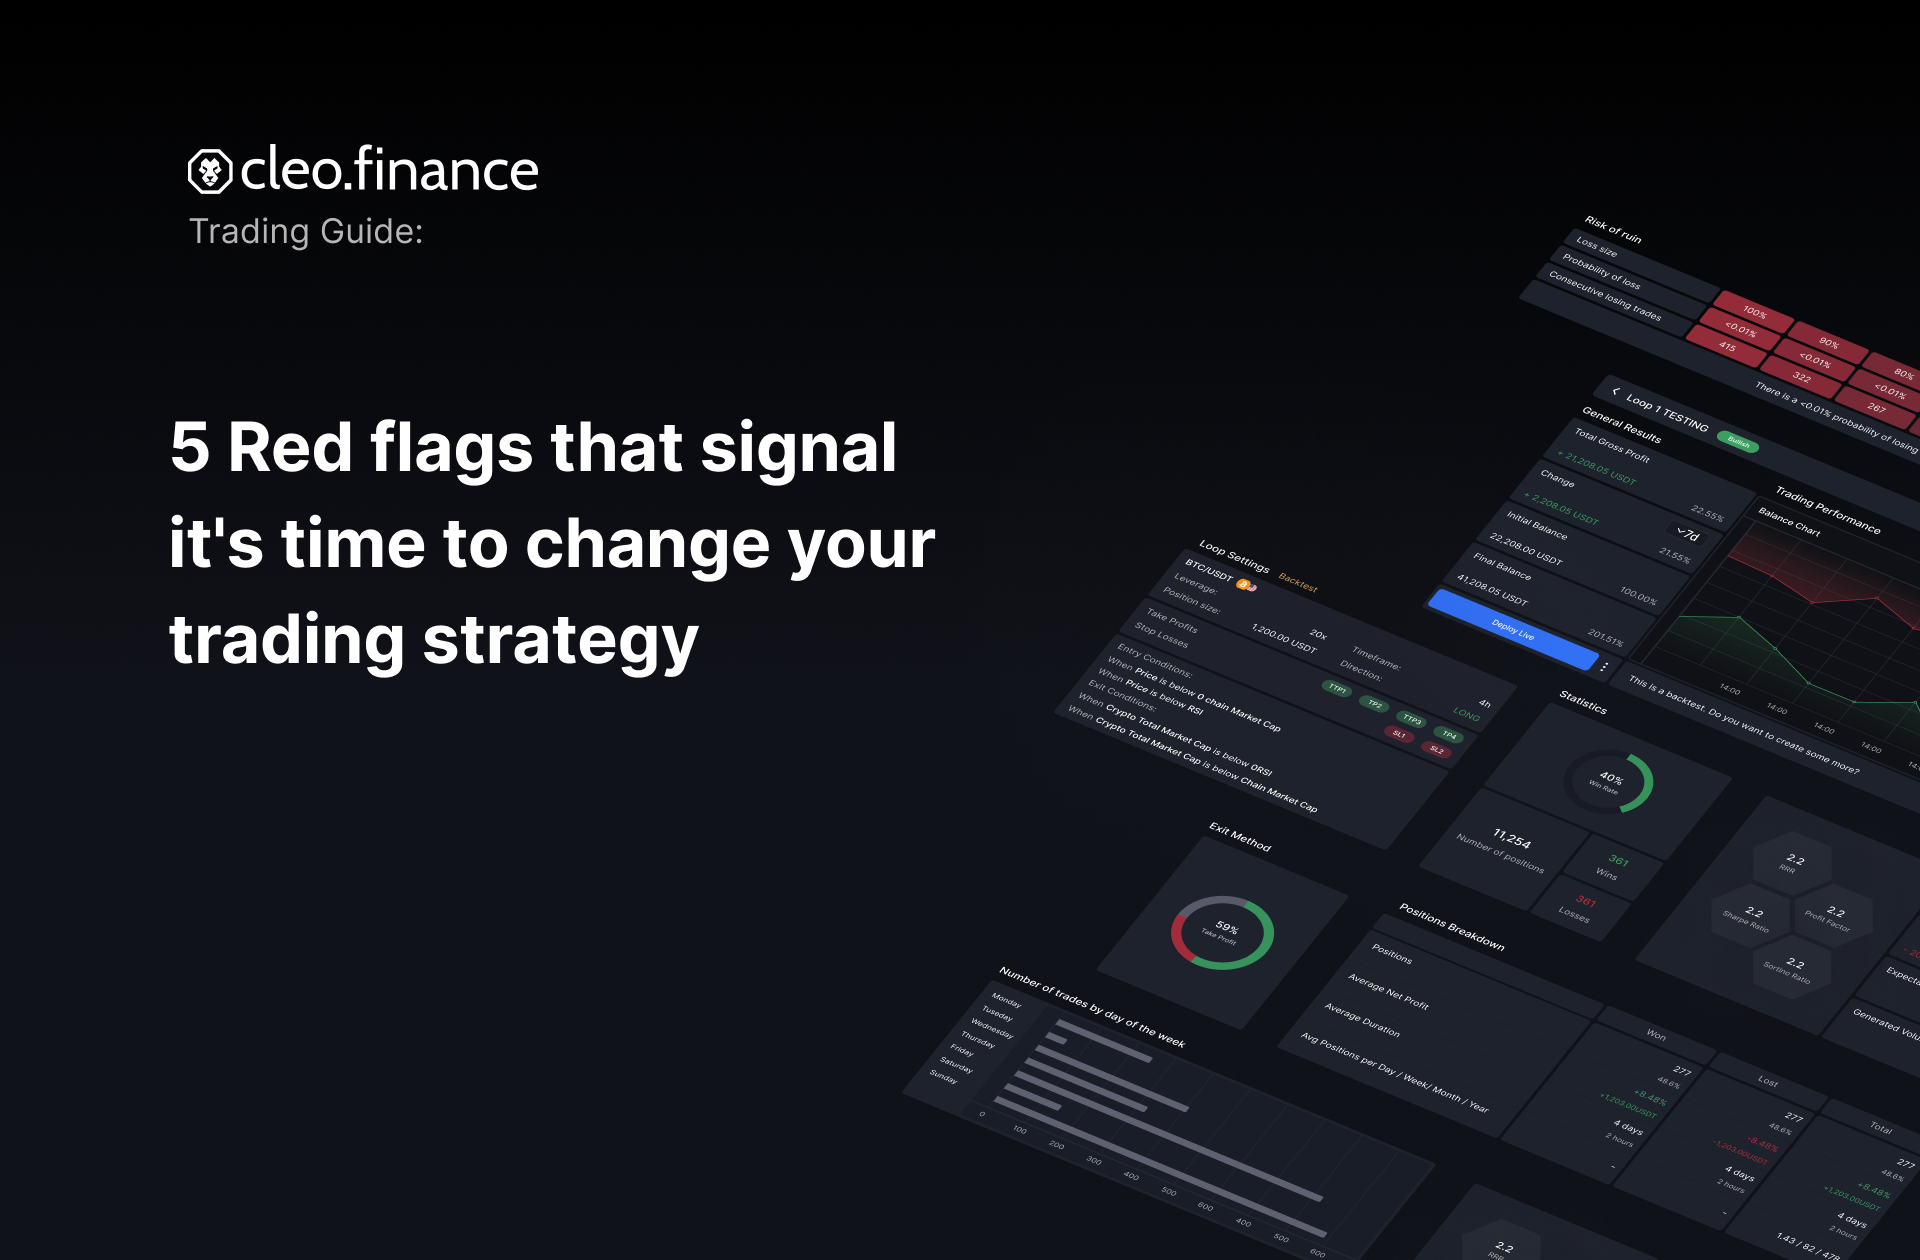
5 red flags that signal it’s time to change your trading strategy10 min read
Trading is a constant balancing act between risk and reward. Developing a successful trading strategy is a significant accomplishment in its own right, but it is equally important to know when it is time to adjust your approach or when to abandon it altogether. To help traders stay ahead of the curve, we’ve identified the 5 telltale red flags that signal it could be time to change your strategy. Whether it’s a shift in market conditions or a decline in performance, these red flags are crucial indicators that something needs to change.
Table of Contents
Why can live trading results deviate from backtest
It is not uncommon for live trading results to differ from the results obtained during backtesting. The main reasons for it are:
Improper Backtesting Methodology
This is kind of an “umbrella term” for everything that can go wrong while backtesting, but the facts remain: Backtesting requires a robust methodology to provide reliable results. If the methodology is flawed, the results of the backtest may not accurately reflect the strategy’s performance. Common issues include overfitting to past data, using insufficient data (or cherry-picking your data – talk about introducing a bias into your results!), or not accounting for transaction costs. Read how to backtest your strategy correctly here.
Overfitting to Past Data
The most common culprit for live trading performance not achieving backtesting expectations is overfitting to past data. Overfitting occurs when a strategy is designed to fit the past performance of a market too closely, leading to a false representation of its potential future performance. Overfitted strategies have beautiful backtesting results but live trading performance fails to deliver even a resemblance of such results. A typical example would be using an overly specific period of any indicator – such as EMA(103).
Strategy Not as Robust as Thought
Backtesting can provide a false sense of security, and traders may not fully appreciate the limitations of their strategy until they begin live trading. For example, a strategy that performs well in a trending market environment may not perform well in ranging conditions, or a strategy may be vulnerable to certain market events that were not accounted for during backtesting.
Execution Issues
Live trading often involves executing trades in real-time, which can be subject to various challenges that were not present during backtesting. For example, slippage, latency, or data inaccuracies can all affect the performance of a strategy.
Market Conditions Have Changed
I almost don’t want to add this one to the list, because I worry most people will use this as a scapegoat, and not examine in detail all the previously mentioned reasons, that they can influence. But the fact is, the market is dynamic, and conditions can change rapidly. Changes in central bank policy, the introduction of new market participants, shifts in investor sentiment, or changes in economic conditions can all impact a strategy’s performance.
You must be aware of these potential issues and take steps to address them. This includes ensuring a robust backtesting methodology, regularly monitoring and adjusting the strategies, and being prepared to adapt to changing market conditions.
What to do if your strategy shows any of these red flags
When you encounter red flags in your trading strategy, it’s crucial to take prompt and decisive action. Personally, if my strategy deviates beyond the backtested results in any of the five metrics mentioned below, I immediately stop live trading and switch to paper trading to monitor its performance.
A robust backtesting methodology should provide a reliable indicator of the strategy’s performance, and any deviation from the backtested results should be taken as a sign that further examination is needed. I cannot recommend any leniency in this matter (translation: Every time I did, it was a painful lesson).
If you’re getting to this position often, it suggests that your backtesting methodology is not robust enough. My guess is: you are either overfitting to past data, or introducing any of the dozens of biases that come with backtesting.
The red flags
I picked these red flags because of their importance or ability to provide a signal early on. It’s important to note that the following list is possibly subjective. Not everyone will agree with me on this list. Everyone will agree, however, that it is a good reason to stop a strategy from live trading if it has significantly deviated from its backtested results.
Many traders mistakenly believe that an automated strategy is a “set-and-forget” system. It’s not. It is crucial to monitor its performance and be prepared to make adjustments or even stop the strategy if necessary. You might monitor different parameters than me, but you need to monitor something. Make sure your hard work of testing and developing a strategy with a positive expectancy doesn’t go to waste.
Max drawdown
The first and most critical red flag to watch out for is the difference in maximum drawdown between the live trading strategy and its backtested version. Maximum drawdown is a measure of the largest decrease from a peak to a trough in the value of your portfolio balance, expressed as a percentage of the drop from the peak value. Say you started with 100, traded the account up to 150 with a handful of wins, and now you are at 135 after two losses. Your current drawdown is 10%, and as long as your drop from the current peak was not higher until now, this is also your max drawdown.
The drawdown curve as a whole is a crucial indicator to monitor. Its other secondary parameters can provide further insight into the performance of your trading strategy. These include:
- The steepness of the drawdown curve – a steep curve indicates a rapid decrease in value caused by a handful of big losses, while a more gradual curve indicates a slower decline – a longer streak of smaller losses.
- The number of trades it took to reach the maximum drawdown – a high number of trades indicates a long period of poor performance, while a low number indicates a short period of sizeable losses.
- Total recovery time – the length of time it takes to recover from the maximum drawdown can provide insight into the resilience of your strategy. Generally, you want a more resilient strategy with quick recovery.
By monitoring these parameters in addition to the maximum drawdown, you can gain a more comprehensive understanding of the performance of your trading strategy and make informed decisions about any necessary changes.
Side note: To help you gauge the downside risk, calculate your strategy’s Ulcer Index.
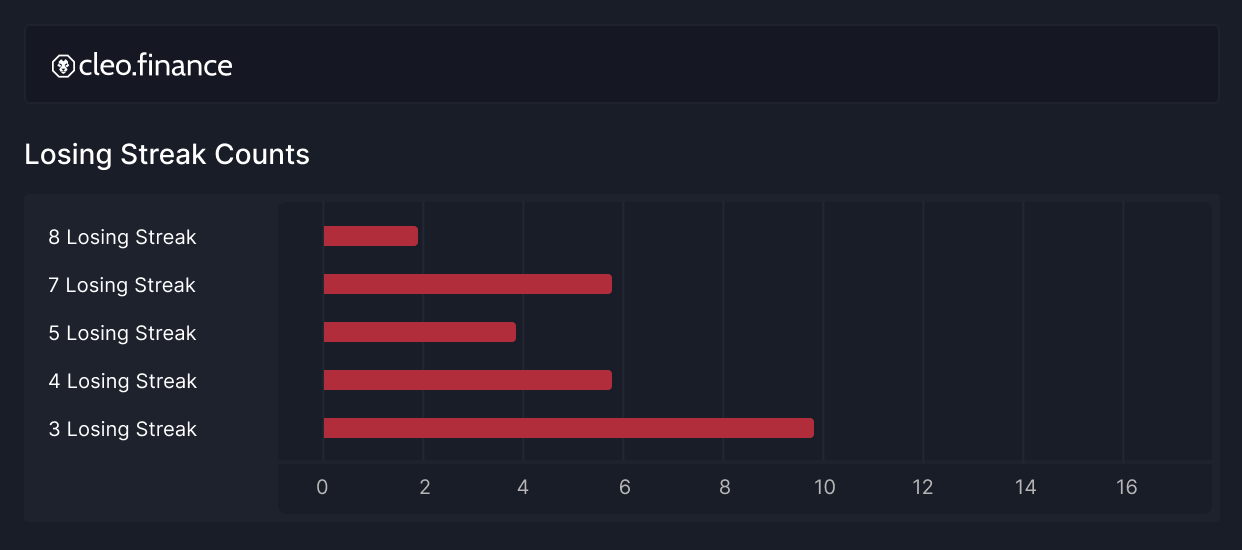
The losing streak length and frequency
A losing streak is a consecutive sequence of trades that result in losses. If the maximum length of the losing streak in live trading exceeds the results obtained during backtesting, it could indicate that the strategy may not be as consistent or reliable as originally believed.
Try to examine how you would feel in these streaks. If, for example, your strategy regularly alternates between wins and losses, you’ll probably feel fine. But if you have periods of long winning streaks and then periods of long losing streaks, it could be emotionally hard to handle. You could get an “itchy hand” and try to fiddle with your strategy even if the losing streak should have been expected since it occurred in the backtest.
The Recovery time
The total drawdown time can be oversimplified as follows:
Total Drawdown Time = Drawdown Time + Recovery Time
We looked at the Drawdown time already – in the first red flag, so let’s examine the recovery time.
The recovery time is the time it takes for the strategy to return to a profitable state from the point of max drawdown.

For the recovery time, I have basically only one rule: It has to be more aggressive, than the drawdown time. I want to see a faster recovery than the drawdown time. This happens when your average win is larger than your average loss. Such behavior I consider healthy, and it only motivates me to look at the drawdown period more closely (Is there a pattern in the drawdown occurrences? Can I identify them and filter them out somehow?)
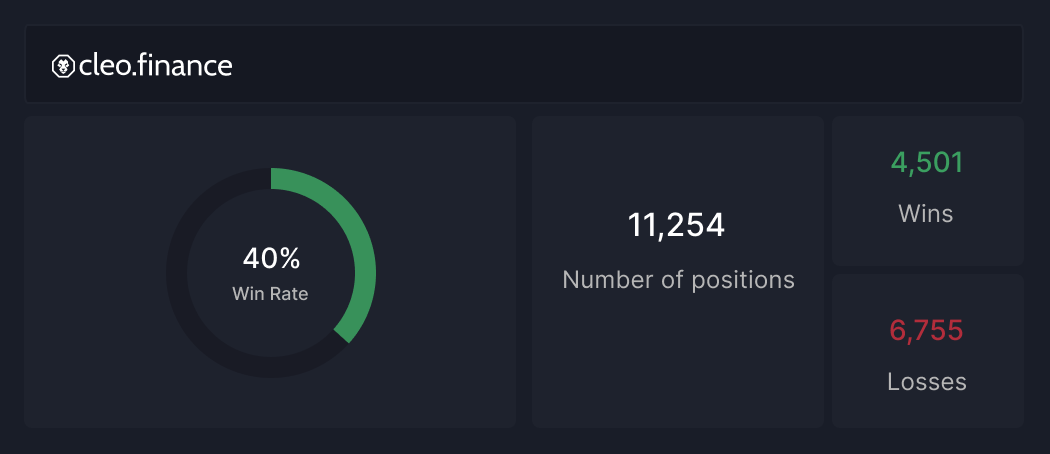
Win rate
This red flag is self-explanatory. The win rate of your live traded strategy should not be significantly different from the backtested version. However, you need to make sure you have enough data before you make any decisions. And therefore it is not the first actionable indicator that something might have gone awry.
The trade duration
The trade duration difference between your strategy’s backtested and live traded versions is another vital red flag to look out for. Trade duration refers to the time a trade is kept open, from entry to exit.
Example: The trade duration in your backtest was anywhere between 30 min and 4 hours. But in live trading conditions, you observe a handful of trades with a duration of 20 hours. Is that a cause of concern for you? Does it warrant stopping the strategy?
Consider the reasons behind such deviations, as it could be an early example of changing market conditions, mismatches in trade execution, or other factors. In the above example, if you opened a trade at the end of the New York session and closed in the London session, maybe the Asian countries had a national holiday and therefore left markets completely illiquid, but the strategy did what was expected.
It is also a good idea to look at the distribution of trades in time. For example, if your backtesting was calibrated to trade during the London and New York sessions, but the live trading strategy generates the majority of trades during the Asian session, this could be a sign of discrepancies that might need to be addressed.
Conclusion
Knowing when to stop a strategy from live trading is integral to the day trading process. By closely monitoring key metrics and values, and comparing them to the results of your backtesting, you can make an informed decision about whether to continue using a strategy, invest time in improving it, or stop it altogether and look for a better one. And whether you monitor the same indicators or develop your own, as long as you regularly check in on your strategy’s results, you are on your way to improving your chances of achieving long-term profitability.
We, at cleo.finance developed a backtesting platform where all of these flags are visualized in a nice and comprehensive manner. We’re trying to make sure that backtesting is as easy (and dare I say fun!) as it can be, and thus help you on your way to finding the next trading strategy with positive expectancy. Give cleo.finance a try, and let us know what you think!